29th Annual RESNA Conference Proceedings
Selecting an Appropriate Scan Rate: The ".65 Rule"
Richard C. Simpson, PhD, ATP, Heidi H. Koester, PhD, Edmund F. LoPresti, PhD
ABSTRACT
Investigators have discovered that the ratio between a user's reaction time and an appropriate scan rate for that user is approximately 0.65, which we refer to as "the .65 rule." As part of a larger effort to develop software that automatically adapts the configuration of switch access software, data was collected comparing subject performance with a scan rate chosen using the .65 rule and a scan rate chosen by the user. Analysis of the data indicates that for many people, the .65 rule produces a scan rate that is approximately the same as the average switch press time plus two standard deviations.
Keywords:
assessment, row-column scanning, computer access
BACKGROUND
Row-column scanning is a technique used by individuals with significant physical impairments for entering text and other data into computers and augmentative communication devices. A common implementation of row-column scanning with one switch requires three switch hits to make one selection from a two-dimensional matrix of letters, numbers, symbols, words, or phrases, as illustrated in Figure 1 . The first switch hit initiates a scan through the rows of the matrix. Each row of the matrix, beginning with the first, is highlighted in turn until the second switch hit is made to select a row. Each column of the row is then highlighted in turn until the target is highlighted, when the third switch hit is made to select the target. Variations on this theme are abundant and include column-row scanning and continuous row scanning which eliminates the first switch hit needed to initiate row scanning [1] .
The scan rate and other configuration parameters for a single-switch row-column scanning system (see Table 1 ) determine the maximum text entry rate (TER) that is possible for a user. Working independently, two groups [2, 3] found that the ratio between a user's reaction time and an appropriate scan rate for that user is approximately 0.65, which we refer to as "the .65 rule." As part of a larger effort to develop the Interface Design Assistant (IDA) - software that automatically adapts the configuration of switch, pointing and text-entry devices to the needs of a user [4] - data was collected comparing subject performance with a scan rate chosen using the .65 rule and a scan rate chosen by the user. These data has been used to analyze whether, and under what conditions, the .65 rule is an appropriate method for choosing an individual's row-column scanning rate.
Parameter |
Description |
Scan Rate |
The amount of time an item remains highlighted for the user to make a selection |
Initial Scan Delay |
Additional delay applied to the first row or column |
Column Scans |
Maximum number of times the columns within a row are scanned |
Layout |
Arrangement of targets within the scanning matrix |
METHODS
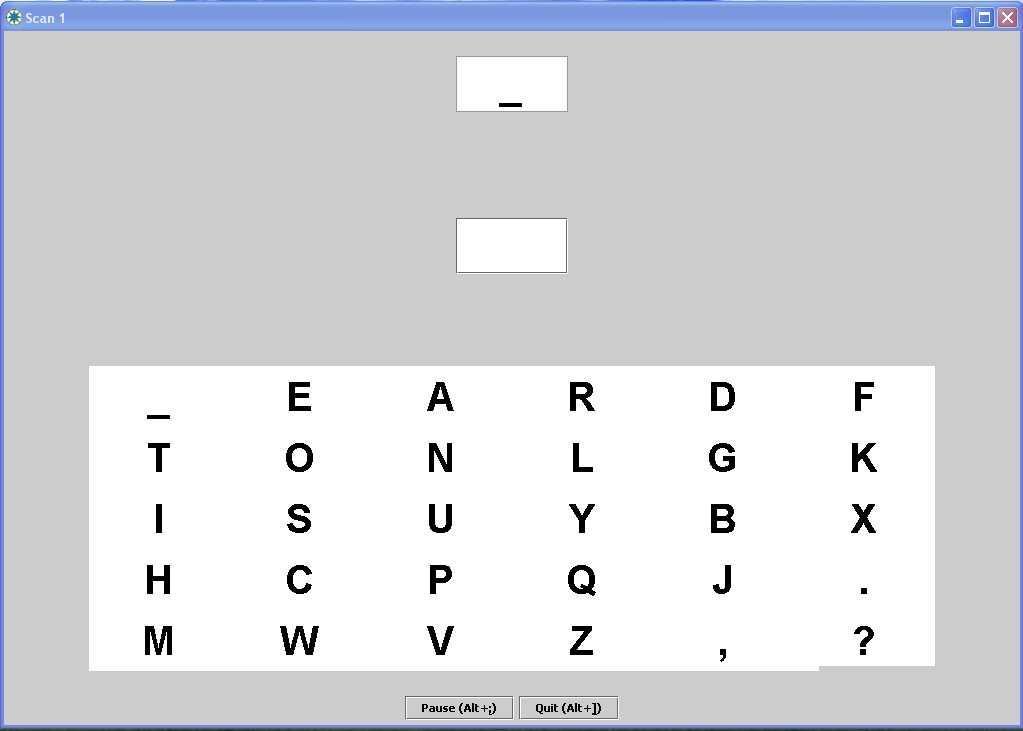 Figure 2. Screen shot from experimental interface (Click image for larger view)
 The protocol focused on recommending an appropriate scan rate to meet the user's current abilities. The goal was to find the ideal midpoint between a scan rate that is too fast, which increases user errors, and one that is too slow, which unnecessarily constrains the user's text entry rate. During testing, subjects used the row-column scanning matrix shown in Figure 2 . Subjects were asked to select the target character (presented in the box above the matrix) using a single switch. The first switch hit initiated row scanning; the second switch hit selected the desired row; and the third switch hit selected a particular letter in that row. The target character changed after the user selected the corresponding character in the scanning matrix or after 60 seconds had elapsed (whichever occurred first).
Subjects
Six individuals with significant physical disability secondary to cerebral palsy participated in this study (see Table 2 ). All six regularly used augmentative communication devices. Four of the six used single-switch scanning to operate their communication device, and the remaining two used direct selection. Switch sites for the non-switch users were chosen based on trial and error. All six subjects were familiar with the letters of the alphabet and the punctuation used in the scanning matrix.
| Subject | Gender | Normal Selection Method |
|---|---|---|
JP |
M |
Direct Select (head-mounted laser pointer) |
JM |
F |
Single Switch (positioned on chest, activated with chin) |
MC |
F |
Direct Select (head-mounted aluminum rod) |
DS |
M |
Single Switch (positioned on inside of right knee, activated by left knee) |
DY |
M |
Single Switch (positioned on left side of headrest, activated with side of head) |
RW |
F |
Single Switch (positioned on stomach, activated with left hand) |
The study was designed to allow for assessment of the scan rate recommended by IDA (using the .65 rule), as well as for a comparison between IDA's recommendation and the user's self-selected scan rate. Each subject participated in one session, which lasted for approximately one hour. Subjects performed a single switch scanning task under 4 different conditions as follows:
Recommendation Phase with IDA (A1).
The initial scan rate for this condition was set to match the scan rate of the subject's communication device (if they used row-column scanning) or was set to one second (if they were direct selectors). After 30 targets were presented, IDA made a scan rate recommendation by dividing the average switch press time by 0.65.
Self-Selection Phase (B1).
As in A1, the initial scan rate for this condition was set to match the scan rate of the subject's communication device or to one second, based on whether the subject regularly used row-column scanning. Like A1, subjects were presented with 30 target letters during the trial. Unlike A1, the subject was given the responsibility for selecting the scan rate. After each character, the subject could request the scan rate to be increased or decreased by 25 milliseconds. Scan rate was adjusted by an investigator, by pressing the up or down arrow key in response to a request from the subject.
Evaluation of Performance with the IDA-Selected (A2) and Self-Selected (B2) Scan Rates.
In both conditions A2 and B2, subjects were presented with 50 target letters. The same set of 50 letters was used in each trial, but the order was randomized for each condition. For the second trial in the IDA-selected condition (A2), the scan rate was set to the value recommended by IDA. For the second trial in the self-selected condition (B2), the scan rate was set to the scan rate used for the final letter in the first self-selected condition (B1). Before condition A2 and B2, subjects completed a three letter warm-up using the scan rate that was chosen by IDA or themselves.
The order of conditions for half the subjects in each group was A1, A2, B1, B2, counterbalanced for the other half of the subjects as B1, B2, A1, A2. This order was chosen because it allowed subjects to immediately work with the scan rate that had just been recommended or selected. Data for each target were used to calculate the following summary measures across all 50 targets in A2 and B2:
- Text Entry Rate (TER) - the average time to select a target;
- Selection Accuracy (SA) - the percentage of targets correctly selected from the matrix;
- Timing Errors (TE) - the percentage of targets during which the user either pressed the switch when the target was not highlighted or failed to press the switch when the target was highlighted.
- Start Scan (SS) - the average time between the target being presented and the first switch press;
- Row Press (RP) - the average time to select a row;
- Col Press (CP) - the average time to select a column;
RESULTS
As shown in Table 3 , subjects took 8.73 seconds to select each letter (with a 95% confidence interval of [6.13, 11.33]) with the scan rate derived by IDA using the .65 rule. They averaged 90.3% selection accuracy [80.9, 99.8] and 15.3% timing errors [3.9, 26.8]. This relatively high accuracy also suggests that the IDA-recommended scan rate was usable by subjects.
| Subject | Scan Rate | Text Entry Rate | Sel'n Accuracy | Timing Errors | ||||
|---|---|---|---|---|---|---|---|---|
| IDA | Self | IDA | Self | IDA | Self | IDA | Self | |
| JP | 859 |
1450 |
12.19 |
13.03 |
76 |
98 |
36 |
18 |
| JM | 1199 |
1325 |
6.54 |
13.45 |
84 |
78 |
6 |
32 |
| MC | 1263 |
2250 |
8.17 |
8.26 |
92 |
84 |
10 |
0 |
| DS | 1110 |
1875 |
8.56 |
8.24 |
98 |
98 |
16 |
6 |
| DY | 891 |
1200 |
5.86 |
7.99 |
92 |
100 |
8 |
8 |
| RW | 1293 |
1200 |
11.06 |
10.82 |
100 |
90 |
16 |
20 |
| Average | 1102 |
1550 |
8.73 |
10.30 |
90.3 |
91.3 |
15.3 |
14.0 |
The data support the hypothesis that a scan rate recommended by the .65 rule yields speed and accuracy performance that is as good or better than performance with subjects' self-selected scan rates. The .65 rule tended to recommend scan rates that were significantly faster than subjects' selected rates, about 22% faster on average. However, this increase in scan rate did not lead to significantly more errors, as both Selection Accuracy and Timing Errors were almost identical across the two scan rate conditions. Somewhat surprisingly, the faster scan rate resulting from the .65 rule did not yield a significantly faster text entry rate, although TER with IDA did average 13.3% faster than TER with self-selected rate.
DISCUSSION
Further exploration of the data provides insight into why, and under what conditions, the .65 rule works. If we assume that switch press time is normally distributed, then a reasonable choice for scan delay is 2 standard deviations off of the mean. This would accommodate 95% of all switch presses. And, in fact, the .65 rule corresponds to 2 standard deviations (approximately) when the ratio of standard deviation to average switch press time is (approximately) 25%. As shown in Table 4 , most of the subjects had a standard deviation to average ratio of about 25%. Both of the subjects with large timing errors (JM-self and JP-IDA) had mean to standard deviation ratios much larger than 25%.
| row | column | ||||||||
|---|---|---|---|---|---|---|---|---|---|
| subject | Cond | scan rate | timing errors (%) | avg | std. dev. | sd:avg | avg | std dev | sd:avg |
| DY | IDA | 891.00 | 8.00 | 607.90 | 118.41 | 0.19 | 598.52 | 161.71 | 0.27 |
| Self | 1200.00 | 8.00 | 628.30 | 159.18 | 0.25 | 645.34 | 140.76 | 0.22 | |
| JM | IDA | 1199.00 | 6.00 | 736.82 | 212.22 | 0.29 | 679.54 | 304.86 | 0.45 |
| Self | 1325.00 | 32.00 | 812.46 | 242.28 | 0.30 | 755.42 | 352.11 | 0.47 | |
| DS | IDA | 1110.00 | 16.00 | 737.64 | 180.92 | 0.25 | 735.64 | 188.13 | 0.26 |
| Self | 1875.00 | 6.00 | 804.82 | 236.44 | 0.29 | 696.54 | 164.50 | 0.24 | |
| JP | IDA | 859.00 | 36.00 | 558.66 | 172.11 | 0.31 | 500.60 | 271.13 | 0.54 |
| Self | 1450.00 | 18.00 | 878.78 | 217.50 | 0.25 | 865.30 | 241.32 | 0.28 | |
| MC | IDA | 1263.00 | 10.00 | 669.54 | 191.04 | 0.29 | 603.94 | 173.94 | 0.29 |
| Self | 2250.00 | 0.00 | 875.12 | 443.50 | 0.51 | 685.34 | 226.52 | 0.33 | |
| RW | IDA | 1293.00 | 16.00 | 871.20 | 170.67 | 0.20 | 822.66 | 186.12 | 0.23 |
| Self | 1200.00 | 20.00 | 773.34 | 191.41 | 0.25 | 666.38 | 227.23 | 0.34 | |
Conclusion
Researchers and clinicians both need a reliable and systematic method for selecting the most appropriate scan rate for single-switch scanning. We suggest that, prior to selecting the scan rate for an individual, researchers and clinicians should determine whether an individual's switch-press time is normally distributed. For individuals with a normally distributed switch-press time, the .65 rule is probably adequate but a more accurate method for choosing scan delay (both in the lab and in the clinic) might be average switch press time plus two standard deviations.
ACKNOWLEDGEMENTS
This research was supported by the NIH (grant #1 R43 HD045015-01) and the NSF (grant #0133395).
REFERENCES
- D. Anson, Alternative Computer Access: A Guide to Selection. Philadelphia: F.A. Davis Co, 1997.
- S. Cronk and W. Wang, "Investigating relationships between user performance and scan delays in aids that scan," in Annual Conference on Rehabilitation Technology (RESNA). Minneapolis, MN: RESNA Press, 2002.
- G. Lesher, J. Higginbotham, B. Moulton, "Techniques for automatically updating scanning delays," in Annual Conference on Rehabilitation Technology (RESNA). Orlando, FL: RESNA Press, 2000.
- H. H. Koester, E. F. LoPresti, and R. C. Simpson, "Toward Goldilocks' pointing device: Determining a "just right" gain setting for users with physical impairments," in ACM SIGACCESS Conference on Assistive Technologies (ASSETS). Baltimore, MD: ACM Press, 2005.
Richard Simpson
Department of Rehabilitation Science and Technology;
University of Pittsburgh;
Forbes Tower, Suite 5044;
Pittsburgh, PA 15260;
412-383-6593;
ris20@pitt.edu
This should be in the right column.