29th Annual RESNA Conference Proceedings
Group Differences in Community Participation by Mobility Device Use
David B. Gray, Ph.D., Holly H. Hollingsworth, Ph.D. and Kerri A. Morgan, MSOT OTR/L
Washington University School of Medicine
Program in Occupational Therapy
St. Louis , Missouri
ABSTRACT
Differences in difficulty of participating in the community at various sites are compared among mobility device users (n=135) in this report. The respondents reported their primary mobility devices (PMD) as power wheelchair (34), manual wheelchair (37), scooter (29), and cane/crutch/walker (35). An instrument, the Community Participation and Perceived Receptivity Survey (CPPRS), was developed to measure factors that influence the participation of people with mobility impairments in doing community activities. The difference in difficulty in participating at a site with and without the persons' primary mobility device produced a score for each community site for each mobility device user. The scores of the device groups differed in the benefits of using their PMD at different sites. These findings can provide direction to improving mobility device selection in rehabilitation.
KEY WORDS:
mobility device, assistive technology, outcomes, community participation, disability
BACKGROUND
According to a National Health Interview Survey conducted in 1994, approximately seven million Americans use some type of mobility device [(1), (2)]. Although assistive devices can have a positive impact on the participation of individuals with mobility limitations, many in this population still experience activity limitations [(3)]. Several different factors affect the participation of those using mobility devices. The type of mobility device, physical ability of the user, and kinds of support the user has can influence engagement in life activities [(4)]. Environmental factors (including physical and attitudinal) in the community can also drastically affect the participation of individuals using both assistive technology (AT) such as mobility devices. Natural and architectural barriers encountered may include curbs, narrow aisles, tight spaces, poor sidewalks, and high-pile carpets [(5)]. Progress has been made in the last decade in developing a framework for studying disability that includes environmental variables. However, many of the problems still exist associated with getting the appropriate optimal fit between reliable, affordable and durable assistive technology for the maximum participation of people with disabilities in activities in which they find important. In part, this deficit is due to the lack of outcome measures that can provide feedback to those who are responsible for assessing the need for AT, designing AT, manufacturing AT, funding AT and using AT. Most of the literature on AT is focused around the issues of design, consumer preferences [(6), (7)], use, disuse and abandonment [(8)] and costs and policy [(9)]. However, very little attention has been given to adverse AT outcomes [(10)] or the influence AT can have on the lives people with mobility limitations [(11)]. The study reported below address consumer's perspective on how their mobility device impacts their participation in the community environment. An outcome assessment designed to measure community participation for people with mobility impairments is utilized.
METHODS
Participants :
The participants consisted of 135 adults between the ages of 18 and 80 who had a mobility impairment requiring the use of ambulatory aids (power wheelchair, manual wheelchair, scooter, or cane(s), crutch (es), walker). All lived in the community and were discharged from rehabilitation at least one year at the time of the study. The sample is a national purposive sample. For the demographic characteristics of the samples see Table 1. Analysis of education levels indicate that power wheelchair users had the highest percentage (44.1%) who attended four or more years of college. In regards to income level, manual wheelchair users had the highest percentage (32.4%) making less than $10,000/year, but also the highest percentage (24.3%) making over $75,000. This sample of people with mobility limitations included a number of different disabilities including spinal cord injury (38.5%), polio (21.5%), multiple sclerosis (8.9%), stroke (8.9%), cerebral palsy (4.4%) and a group of other (52.6%) that included arthritis, heart conditions and other conditions resulting in the need to use a mobility device.
| Total Population N=135 | Percentages per Group | ||||
|---|---|---|---|---|---|
| PW (N=34) |
MW (N=37) |
SC (N=29) |
CCW (N=35) |
||
| Mobility Device Breakdown | - |
21.5 |
27.4 |
25.9 |
25.2 |
Gender |
|||||
| Male | 48.1 |
64.7 |
45.9 |
51.7 |
31.4 |
| Female | 51.9 |
35.3 |
54.1 |
48.3 |
68.6 |
Race |
|||||
| Asian/Pacific Islander | 0.7 |
0.0 |
2.7 |
0.0 |
0.0 |
| Black/African American | 5.2 |
5.9 |
5.4 |
6.9 |
2.9 |
| White | 91.9 |
91.2 |
86.5 |
93.1 |
97.1 |
| Hispanic/Latino Origin | 2.3 |
0.0 |
5.7 |
0.0 |
2.9 |
| Other | 2.2 |
2.9 |
5.4 |
0.0 |
0.0 |
Marital Status (May have chosen more than one option) |
|||||
| Married | 47.0 |
41.2 |
51.4 |
55.2 |
41.2 |
| Divorced | 18.7 |
8.8 |
27.0 |
20.7 |
17.6 |
| Widowed | 6.7 |
5.9 |
0.0 |
6.9 |
14.7 |
| Separated | 4.5 |
8.8 |
2.7 |
0.0 |
5.9 |
| Never Married | 20.9 |
29.4 |
16.2 |
17.2 |
20.6 |
| Member of Unmarried Couple | 2.2 |
5.9 |
2.7 |
0.0 |
0.0 |
Highest Level Education |
|||||
| Grade 1-11 | 1.5 |
2.9 |
0.0 |
3.4 |
0.0 |
| Grade 12 or GED | 19.3 |
11.8 |
18.9 |
20.7 |
25.7 |
| College 1-3 years | 43.0 |
41.2 |
43.2 |
44.8 |
42.9 |
| College 4 or more years | 36.3 |
44.1 |
37.8 |
31.0 |
31.4 |
Primary Disability |
|||||
| SCI | 38.5 |
58.8 |
70.3 |
3.4 |
14.3 |
| MS | 8.9 |
2.9 |
10.8 |
6.9 |
14.3 |
| CP | 4.4 |
2.9 |
5.4 |
3.4 |
5.7 |
| Polio | 21.5 |
20.6 |
5.4 |
41.4 |
22.9 |
| Stroke | 8.9 |
8.8 |
5.4 |
0.0 |
20.0 |
| Other | 52.6 |
44.1 |
37.8 |
69.0 |
62.9 |
Annual Personal Income |
|||||
| Less than $10,000 | 26.1 |
29.4 |
32.4 |
17.9 |
22.9 |
| $10,000 - $24,999 | 37.3 |
41.2 |
21.6 |
42.9 |
45.7 |
| $25,000 - $44,999 | 15.7 |
17.6 |
13.5 |
21.4 |
11.4 |
| $45,000 - $74,999 | 12.7 |
8.8 |
8.1 |
17.9 |
17.1 |
| $75,000 or more | 8.2 |
2.9 |
24.3 |
0.0 |
2.9 |
| Note: PW = Power Wheelchair; MW = Manual Wheelchair; SC = Scooter; CCW = Cane/Crutches/Walker | |||||
Assessment :
The Community Participation and Perceived Receptivity Survey measures the quality of participation across sites in the community. The survey is personalized to the person depending on where they go and how important it is for them to go to a particular community site. The Community Activity Form is used to determine which sections of the CPPRS the respondent will complete. The Community Activity Form (CAF) asks the respondent to indicate which community sites they have visited in the last month (ex: grocery store, place of employment) and within the last year (ex: doctor's office, sports arena) as well as if it is important for them to visit these sites. In the CPPRS for each site the person may indicate barriers to community participation including personal factors (pain, fatigue, illness, physical impairment, and self-concept), environmental factors (such as lack of assistance, lack of special equipment, physical factors in the environment, social attitudes, and lack of transportation), and level of assistance needed (such as a personal assistant or an assistive technology device) while visiting the site, as well as evaluative questions related to how satisfied and how much choice they have while visiting the site. For sites the person selects as important but they are unable to go, the person can then indicate several possible barriers that cause them to be unable to participate at that community site.
The difficulty in going to community activities for the four groups of mobility device users were compared using two specific questions from the CPPRS: With your primary mobility device, going to 'a location' is (very easy, easy, difficult or very difficult); and Without your primary mobility device, going to 'a location' is (very easy, easy, difficult, very difficult, Cannot do at all). For examples of the survey questions see Table 2.
| How often do you use your primary mobility device at grocery stores? | ||||
| Always | Sometimes | Never (Go to question 6.) | ||
| 5a. With your primary mobility device, going to grocery stores is . | ||||
| Very easy | Easy | Difficult | Very difficult | |
| 5b. Without your primary mobility device, going to grocery stores is . | ||||
| Very easy | Easy | Difficult | Very difficult | Can't do at all |
Procedures:
The Washington University human subjects committee approved all procedures. Participants were recruited through different disability organizations (such as support groups and independent living centers). All interested participants were screened over the telephone. During the screening, all participants were asked what primary mobility device they used most often while participating in the community. Participants were instructed to answer the questions related to the device they indicated is their primary device. Participants had the choice of completing a web-based survey or a paper copy of the survey. All participants that selected the computer-based survey were sent a web-link to access the survey. All participants that selected the paper copy were sent the survey with a postage paid envelope in which to return the survey. The survey took approximately 1 to 1.5 hours to complete.
Analysis:
The data was analyzed using descriptive and inferential statistics. Trends in the data were identified and reported for difficulty participating at community sites both using and not using their primary mobility. The difference in difficulty in going to a location with and without the persons' primary mobility device produced a score for each site for each mobility device user [(Without PMD - With PMD)/With PMD]. Scores on this variable range from zero to four with higher scores indicating greater benefits for community participation when the individual used their primary mobility device. Also, one way analyses of variances were conducted to compare participation by device at sites of importance as well as monthly and yearly.
RESULTS
Overall, the difficulty in participating in community activities without a primary mobility device (PMD) was much higher than when a PMD was used. Power wheelchair users report a high level of difficultly without their PMD while CCW report participation as easy without their PMD.
Device Group Differences in Monthly and Annual Activities in Communities
The results show that the influence on reducing the difficulty in participation in all community activities performed on a monthly basis was significantly greater for power wheelchairs than the three other PMD groups. For going to places less than monthly but at least annually, power and manual wheelchairs benefit their users significantly more than scooters and cane/crutch/walker users (see Table 3).
| N | Mean | Std. Deviation | Pairwise | Sig Differences | ||||
| Sample total | 135 | PW | MW | Scooter | CCW | |||
| Monthly | Power wheelchair | 34 | 2.1 | 0.8 | ns | ns | ns | ns |
| Manual | 37 | 1.4 | 0.8 | 0.00 | ns | ns | ns | |
| Scooter | 29 | 1.1 | 0.8 | 0.00 | ns | ns | ns | |
| Cane/Crutches/Walker | 35 | 0.5 | 0.4 | 0.00 | 0.00 | 0.01 | ns | |
| Yearly | Power wheelchair | 33 | 1.9 | 0.9 | ns | ns | ns | ns |
| Manual | 37 | 1.6 | 0.8 | ns | ns | ns | ns | |
| Scooter | 29 | 1.3 | 1.0 | 0.03 | ns | ns | ns | |
| Cane/Crutches/Walker | 34 | 0.5 | 0.4 | 0.00 | 0.00 | 0.00 | ns | |
| Total | 133 | 1.3 | 0.9 | ns | ns | ns | ns | |
Device Group Difference at specific sites
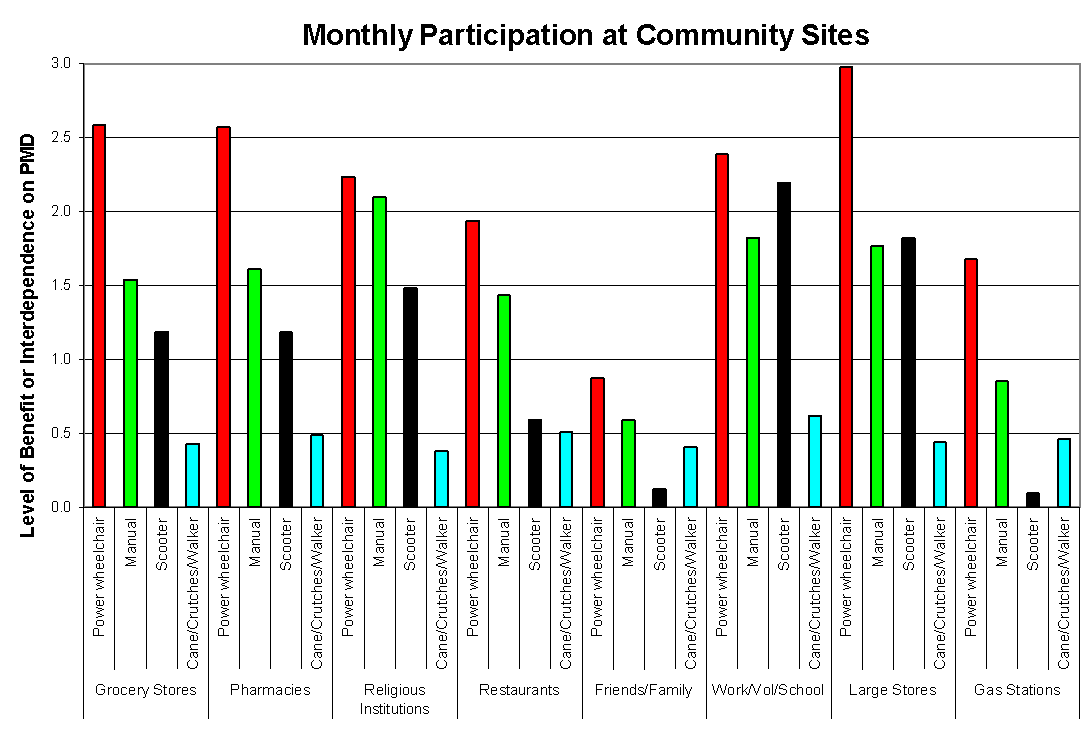 Figure 1 d (Click image for larger view)
 The relative benefits of primary mobility device use differ in participating at many community sites (see Figure 1 and 2). Power wheelchair users benefited in participation across all activities when compared to the other three PMD groups. The benefit of using a PMD showed no significant differences between device groups for participation at four community sites visited at least annually (airports, vacations, sports arenas, DME supply stores) (see Figure 2) but for the sites visited at least monthly (see Figure 1), the device groups differed in the benefits of using their PMD. Power wheelchair users report significantly more benefit to using their PMD in grocery stores and large stores when compared to the three other device groups. The group of cane/crutches/walker users showed the least benefit from the use of their device in participating in nearly every community activity. Large stores and shopping malls are sites where the differences in benefits of using their PMD show significant differences when all device groups are compared to the CCW group.
DISCUSSION
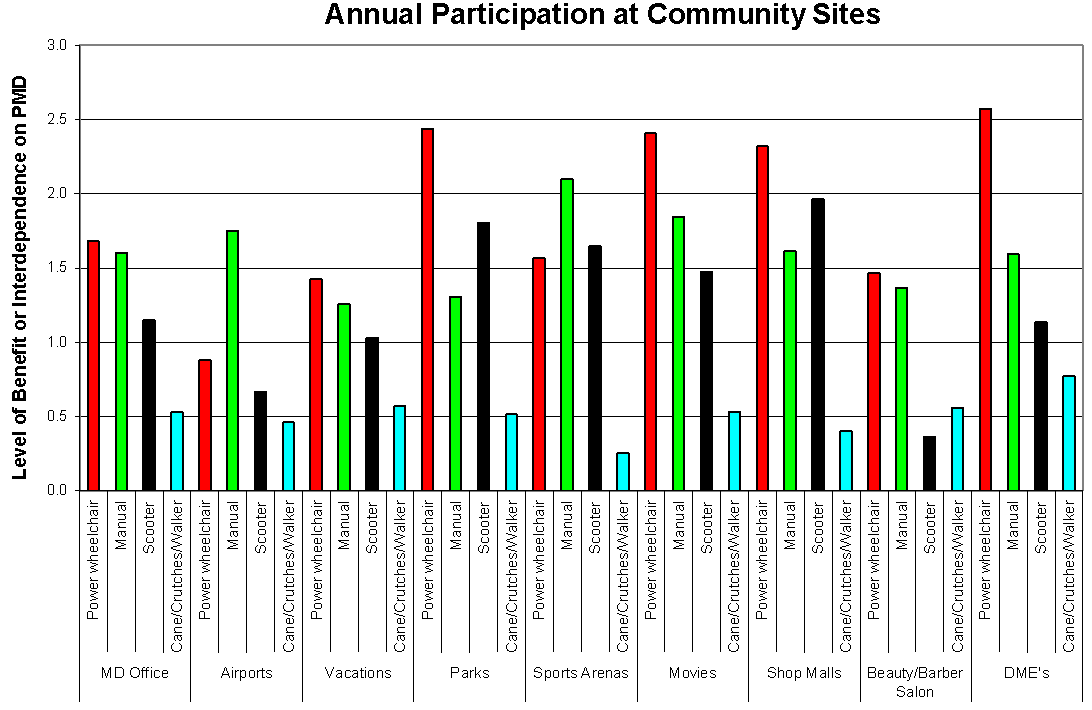 Figure 2 d (Click image for larger view)
The results of this study show the difficulty in participating at community sites with a primary mobility device and without a primary mobility device. When looking at the results the means of the device groups seem low. One explanation, is that three power wheelchair users reported going to places without their PMD is not impossible, difficult but not impossible. This reduced the mean scores from 4 downward. The other possible reason for the means scores to be lower than expected is that some participants who report participation at a site as impossible also reported even with their PMD participation is still difficult. Thus, the benefit is not as significant.
Making participation in community activities less difficult is a major goal of rehabilitation. The findings discussed above can provide direction to improving device selection and use. For example, the results show that power wheelchair users report having the least amount of difficultly in participating in several community sites. Taken this results indicates that more attention needs to be paid to selecting the appropriate mobility device for the consumer.
REFERENCES
- Russell, J.N., Hendershot, G.E., LaClere, F., Howie, J., & Adler, M. (1997). Trends and differential use of assistive technology devices: united states , 1994. Advance Data 292 , 1-10.
- Kaye, H., Kang, T., & LaPlante, M. (2000). Mobility device use in the united states . Disability Statistics Report, (14). Washington D.C. : U.S. Department of Education, National Institute on Disability and Rehabilitation Research.
- Kaye, H., Kang, T., & LaPlante, M. (2002). Wheelchair Use in the United States . Disability Statistics Abstract, (23). Washington D.C. : U.S. Department of Education, National Institute on Disability and Rehabilitation Research.
- Coolen, A.L., Kirby, R.L, Landry, J., MacPhee, A.H., Dupuis, D., Smith, C., Best, K.L., MacKenzie, D.E., & MacLeod, D.A. (2004). Wheelchair skills training program for clinicians: a randomized controlled trial with occupational therapy students. Archives of Physical Medicine and Rehabilitation 85 , 1160-7.
- Routhier, F., Vincent, C., Desrosiers, J., & Nadeau, S. (2003). Mobility of wheelchair users: a proposed performance assessment framework . Disability and Rehabilitation 25 (1), 19-34
- Batavia , A. & Hammer, G., Toward the development of consumer-based criteria for the evaluation of assistive devices. Journal of Rehabilitation Research, 1990, 27, 425-436.
- Phillips, B., & Zhao, H. (1993). Predictors of assistive technology abandonment. Assistive Technology, 5 , 36-45.
- Gitlin, L. N., Corcoran, M., & Leinmiller-Eckhart, S. (1995). Understanding the family perspective: An ethnographic framework for providing occupational therapy in the home. American Journal of Occupational Therapy, 49 (8), 802-809.
- O'Day, B.L., & Corcoran, P.J. (1994). Assistive technology: Problems and policy alternatives. Archives of Physical Medicine and Rehabilitation, 75 , 1165-1169.
- Kincaid (1995). Assitive Technology and the Prevention of Secondary Disabling Conditions Among Persons with Spinal Cord Injury. Syracruse , NY , Syracruse University : 1-7.
- Gray, D. B., Gray , M.E. , White, G., & Froehlich, K. A Survey of Spouses of Members of the Paralyzed Veterans of America : Self-Perceptions of Personal Strengths, Marital Satisfaction, Personal Assistance and Assistive Environments : 57.
ACKNOWLEDGEMENTS
This study was funded by the National Institute on Disability and Rehabilitation Research
Author Contact Information:
David B. Gray, Ph.D.
Washington University School of Medicine
Program in Occupational Therapy
4444 Forest Park Blvd.
Campus Box 8505
St. Louis , MO 63108
voice: (314) 286-1658
email:grayda@wustl.edu
This should be in the right column.