29th Annual RESNA Conference Proceedings
On the Impact of Data Collection on the Quality of Signal Strength Signatures in Wi-Fi Indoor Localization
John Nicholson and Vladimir Kulyukin
Computer Science Assistive Technology Laboratory
Department of Computer Science
Utah State University
Logan, UT 83422-4205
ABSTRACT
Wi-Fi signals can be used to localize navigators at topological landmarks in indoor and outdoor environments. A major issue with Wi-Fi topological localization is calibration. This paper describes the impact of data collection on the quality of signal strength signatures.
KEYWORDS
Visual impairment; blindness; assisted navigation; indoor localization; Wi-Fi; 802.11.
BACKGROUND
Using Wi-Fi 802.11 signals for localization is growing in popularity [1,2,3] due to their wide deployment and affordability. Some projects, such as PlaceLab [1], are using Wi-Fi to replace or supplement GPS in outdoor environments. The objective is to bring the calibration time to a minimum by pairing single GPS readings to available Wi-Fi signal strengths at known locations. However, the reported localization accuracy fluctuates between 13 and 40 meters, which may be too inaccurate for the indoor wayfinding needs of the visually impaired.
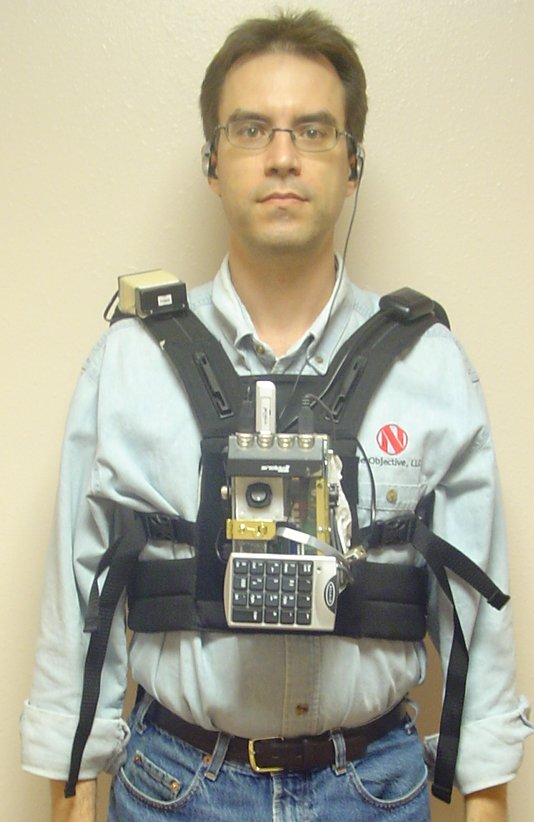 Figure 1: d Wayfinder System (Click image for larger view)
Another method for Wi-Fi indoor localization is to create a topological map of the environment and develop signal signatures of selected landmarks through data collection and pre-processing. The quality of signal signatures is critical, because Wi-Fi signals vary over time and are susceptible to interference that comes from other wireless devices in the same frequency range, solid objects, human bodies, and multi-path issues [2].
HYPOTHESIS
It is hypothesized by the investigators that the quality of signal signatures is dependent on the time of day when data collection occurs.
METHOD
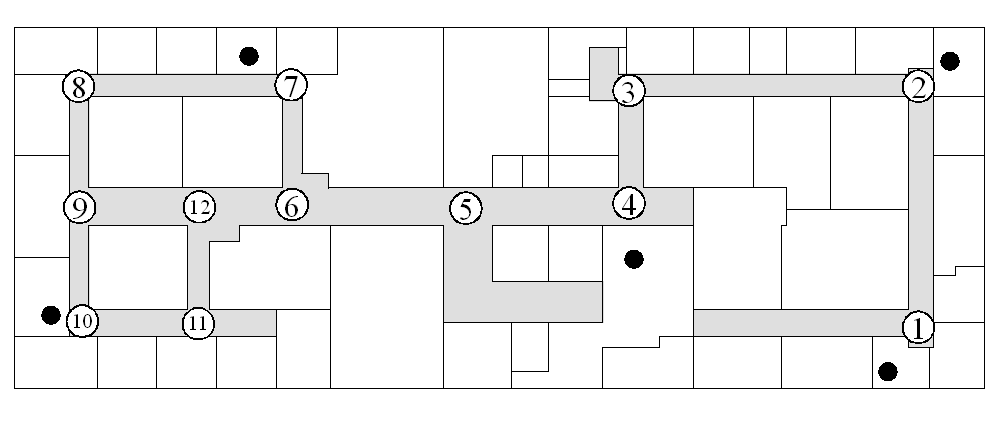 Figure 2: d Map of the USU Computer Science Department with an example route shown. Black circles represent access points. Circled numbers represent locations. The route covers locations 1 to 5. (Click image for larger view)
Data collection was done with a wearable multi-sensor wayfinding test bed called the Wayfinder (see Figure 1). The device uses a wireless card that allows the signal strength to be collected from five wireless access routers placed at different locations in the USU Computer Science Department (see Figure 2). Data were collected two ways: statically and dynamically.
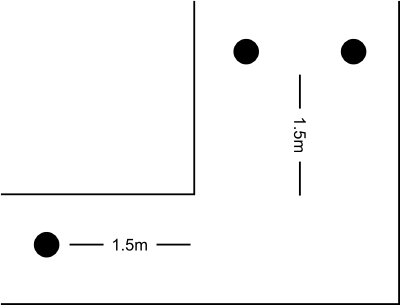 Figure 3: d Collection positions at a corner location. Black dots represent collections positions. Collection positions were 1.5 meters from the actual location. Narrow halls had one collection position, wide halls had two. (Click image for larger view)
Static data were collected over a period of a month and a half. Data collection for locations 1 through 5 was completed first and then the remaining locations' data were collected. Data were collected once per day for each location in a group (1-5 and 6-12). Locations were collected one immediately after another. Locations had at least two collection positions. A collection position (see Figure 3) is where the data collector stood while gathering signal strength information. As in other systems [2, 3], the user's orientation is taken into consideration, so at each collection position, data were collected with the collector facing each direction of the hall for 2 minutes at a time. For example, if a collection position was in a hall which ran north/south, then data were collected for 2 minutes facing north and then 2 minutes facing south. Directionality was taken into consideration because of the effect of the human body on the signal strength. Data collection was performed on 10 different days so 20 minutes of data were collected at each collection position for each direction of the position's hall, in other words a total of 40 minutes data for a collection position.
Dynamic data were collected by walking a series of four routes around the CS Department. Each route was walked 15 times in both directions for a total of eight routes. Figure 2 shows the path for one of the routes. In order to record when the user was at the locations, masking tape was placed on the floor 0.5 meters before and after each collection position. During a walk, the user pressed a key on the system to record whenever they passed over a piece of tape. All walks for all routes were completed on the same day in one data collection session. Note that although the static data was collected over multiple days, all dynamic data was collected on a single day.
Naive Bayes and C4.5 were used to pre-process the collected data. Thus, signal signatures were numerical classes created by these two algorithms. To measure the impact of data collection on the quality of signal signatures, three types of validation were attempted at run time: 1) static on static, 2) static on dynamic, and 3) dynamic on dynamic. For the static on static validation, the signatures were created from each day of static data and validated with the other static datasets. For the static on dynamic validation, the signatures were created from each day of static data and validated with the dynamic data. Finally, for the dynamic on dynamic test, the signatures were created from the dynamic data for each route and were validated with the dynamic data from all the routes. If the training dataset and the validation datasets were the same, e.g. the same day of static data, then the dataset was split so that 66% of the data were used for training and 33% of the data for validation. Otherwise, 100% percent of the training dataset and 100% of the validation dataset were used.
RESULTS
Dataset Day |
Bayes |
C4.5 |
| 2005-01-03 | 0.982892 | 0.999602 |
| 2005-01-04 | 0.979402 | 0.999830 |
| 2005-01-05 | 0.970853 | 0.999678 |
| 2005-01-11 | 0.988162 | 0.999830 |
| 2005-01-12 | 0.968064 | 0.999016 |
| 2005-01-13 | 0.992520 | 0.999792 |
| 2005-01-20 | 0.954853 | 0.998335 |
| 2005-01-26 | 0.943970 | 0.998845 |
| 2005-02-01 | 0.974570 | 0.999659 |
| 2005-02-02 | 0.957489 | 0.997861 |
| Training Day | Bayes Average | Bayes Max | Bayes Min | C4.5 Average | C4.5 Max | C4.5 Min |
|---|---|---|---|---|---|---|
| 2005-01-03 | 0.963299 | 0.985881 | 0.938110 | 0.947295 | 0.985117 | 0.900284 |
| 2005-01-04 | 0.936516 | 0.979617 | 0.873530 | 0.928698 | 0.979009 | 0.856595 |
| 2005-01-05 | 0.946472 | 0.986248 | 0.871559 | 0.920312 | 0.957741 | 0.869446 |
| 2005-01-11 | 0.949799 | 0.978475 | 0.930835 | 0.952160 | 0.976834 | 0.925226 |
| 2005-01-12 | 0.940417 | 0.986158 | 0.854863 | 0.929767 | 0.991057 | 0.859771 |
| 2005-01-13 | 0.937436 | 0.973018 | 0.856570 | 0.920374 | 0.972020 | 0.845039 |
| 2005-01-20 | 0.912735 | 0.978265 | 0.827666 | 0.887077 | 0.956317 | 0.753148 |
| 2005-01-26 | 0.936857 | 0.979829 | 0.843126 | 0.943860 | 0.975973 | 0.915822 |
| 2005-02-01 | 0.935468 | 0.989429 | 0.865968 | 0.931121 | 0.976527 | 0.867669 |
| 2005-02-02 | 0.934006 | 0.989783 | 0.846740 | 0.930395 | 0.981845 | 0.836240 |
| Training Day | Route | Bayes | C4.5 |
|---|---|---|---|
2005-01-03 |
1 |
0.916771 |
0.872834 |
2005-01-03 |
5 |
0.889491 |
0.867207 |
2005-01-03 |
both |
0.903284 |
0.870052 |
2005-01-04 |
1 |
0.891945 |
0.885039 |
2005-01-04 |
5 |
0.860265 |
0.866719 |
2005-01-04 |
both |
0.876283 |
0.875982 |
2005-01-05 |
1 |
0.885456 |
0.789962 |
2005-01-05 |
5 |
0.894362 |
0.878775 |
2005-01-05 |
both |
0.889859 |
0.833870 |
2005-01-11 |
1 |
0.840686 |
0.896172 |
2005-01-11 |
5 |
0.868668 |
0.865136 |
2005-01-11 |
both |
0.854520 |
0.880828 |
2005-01-12 |
1 |
0.888492 |
0.879324 |
2005-01-12 |
5 |
0.876279 |
0.860753 |
2005-01-12 |
both |
0.882454 |
0.870142 |
2005-01-13 |
1 |
0.804310 |
0.785378 |
2005-01-13 |
5 |
0.904165 |
0.880723 |
2005-01-13 |
both |
0.853677 |
0.832516 |
2005-01-20 |
1 |
0.790439 |
0.865750 |
2005-01-20 |
5 |
0.874452 |
0.856612 |
2005-01-20 |
both |
0.831974 |
0.861232 |
2005-01-26 |
1 |
0.879086 |
0.908912 |
2005-01-26 |
5 |
0.890283 |
0.877679 |
2005-01-26 |
both |
0.884621 |
0.893471 |
2005-02-01 |
1 |
0.799131 |
0.879145 |
2005-02-01 |
5 |
0.908427 |
0.879688 |
2005-02-01 |
both |
0.853165 |
0.879414 |
2005-02-02 |
1 |
0.826874 |
0.891647 |
2005-02-02 |
5 |
0.891805 |
0.892840 |
2005-02-02 |
both |
0.858975 |
0.892237 |
| Training Route | Validation Route | Bayes | C4.5 |
|---|---|---|---|
1 |
1 |
0.944843 |
0.996148 |
1 |
5 |
0.603385 |
0.713833 |
1 |
both |
0.776406 |
0.856777 |
5 |
1 |
0.554921 |
0.642496 |
5 |
5 |
0.982274 |
0.999463 |
5 |
both |
0.767105 |
0.818549 |
both |
1 |
0.882062 |
0.991129 |
both |
5 |
0.899476 |
0.991963 |
both |
both |
0.890315 |
0.991856 |
The static-on-static and the dynamic-on-dynamic tests had the same training and validation dataset. In these cases, both classifiers, Bayes and C4.5, tend to give accurate results: 94% accuracy or higher. However, this performance does not carry over to training and validation on different data sets. In other words, when signal signatures are created from a data set collected on a day different from the day of the validation data set, localization accuracy varies. Although the dynamic data were only collected on one day, it is reasonable to conjecture that a walk taken over the same route on a different day will display the same problems as static data on different days, but this still needs to be verified. The quality of signal signatures appears to be dependent on the time of day when data collection occurs. It remains to be investigated how the quality of signal signatures depends on the amount of collected data.
REFERENCES
- Cheng, Y., Chawathe Y., LaMarca A., Krumm J. (2005). Accuracy characterization for metropolitan-scale Wi-Fi localization. Proceedings of the 3rd international conference on Mobile systems, applications, and services. Seattle, Washington.
- Ladd, A., Bekris, K., Rudys A., Wallach, D., and Kavrakia, L. (2004). On the Feasibility of Using Wireless Ethernet for Indoor Localization. Transactions on Robotics and Automation, 20, No. 3.
- Seshadri, V., Zaruba G. V., and Huber M. (2005). A Bayesian Sampling Approach to In-door Localization of Wireless Devices Using Received Signal Strength Indication. Third IEEE International Conference on Pervasive Computing and Communications, 2005. Kauai Island, Hawaii.
ACKNOWLEDGMENTS
The study was funded by two Community University Research Initiative (CURI) grants from the State of Utah (2003-04 and 2004-05) and NSF Grant IIS-0346880. The authors would like to thank Mr. Sachin Pavithran, a visually impaired training and development specialist at the USU Center for Persons with Disabilities, for his feedback on the localization experiments.
Author Contact Information:
Vladimir Kulyukin, Ph.D.
Assistive Technology Laboratory
Department of Computer Science
Utah State University
4205 Old Main Hill
Logan, UT 84322-4205
Office Phone (435) 797-8163.
EMAIL: vladimir.kulyukin@usu.edu .
This should be in the right column.