Optimizing Computer Workstations for Users with Low Back Pain (LBP)
Scott Haynes, MBME
ABSTRACT
The importance of postural support and placement of tools for developing workplace accommodations is well known among wheelchair seating specialists. However, typical computer workstations do not include the adjustments and structure necessary to provide adequate postural support for people who might benefit from alternative working postures. This paper compares the results of two similar tests that measured the impact of working posture on user comfort. The first test provided the user with minimal arm support and maintained a consistent relative position for those supports and computer peripherals in each of five alternative working postures. The second test used the same postures but altered the arm supports and computer peripheral positions to maximize user comfort. The results indicate not only improved user comfort with the optimized positioning but also a change in the perceived rank order of preferred working postures relative to the typical upright working posture.
KEYWORDS:
low back pain, working posture, computer position
BACKGROUND
Proper postural support is key to maximizing functional independence and productivity whether in a wheelchair or in an office chair. Incorrect postures used repeatedly over a long period of time can lead to a variety of musculo-skeletal problems or can exacerbate existing problems such as low back pain (LBP) (1). Over the years, several attempts have been made to address the desires of computer operators to work from alternative postures either in the form of computer workstations available in the marketplace (2), or in the form of custom designed and fabricated solutions (3).
One feature that tends to be included in the custom-based solutions which may be overlooked in the off-the-shelf products is the provision of adequate positioning mechanisms beyond that of the typical office workstation. The position of computer peripherals and the inclusion of proper arm, leg, and head support can be an important factor in determining the comfort and postural preference of computer operators, especially when atypical working postures are indicated. Therefore, the purpose of this study was to investigate the impact of position optimization (i.e. optimization of computer peripheral placement and arm support adjustment) on the comfort and posture preferences for people with and without LBP.
METHODS
This research study involved repeating a previously completed test protocol (4). In both cases, the test was a single factor repeated measures study in which participants completed three five-minute typing trials from five randomly assigned working postures. The seat and back angles for each posture are listed in Table 1. For each trial, the participant’s typing speed and accuracy were recorded. The participant also provided body part discomfort (BPD) scores, using the Borg Pain scale (5), for each of 25 specific body parts following each typing trial. At the conclusion of the three typing trials, each participant provided an overall comfort (OC) score for each posture based on a Shackel comfort scale (6).
| Posture | Seat Angle a | Back Angle b | Seat-to-Back Angle |
|---|---|---|---|
Upright (U) |
5 |
75 |
100 |
Tilted (T) |
40 |
40 |
100 |
Reclined ® |
5 |
50 |
125 |
Zero Gravity (ZG) |
40 |
15 |
125 |
Full Recline (FR) |
5 |
15 |
160 |
| a measured from front horizontal plane b measured from rear horizontal plane |
|||
In the previously completed test, the computer peripherals and arm supports on the computer workstation were adjusted according to the preferences of each participant for the Upright (U) posture only. The relative positioning of these adjustments was maintained for that participant, for each of the five postures. However, for the current test, adjustments were made to the computer peripherals and arm supports after each typing trial, according to feedback from the participant and experience of the research facilitators. The goal of these adjustments was to optimize the user comfort for each posture by the end of the third typing trial. Results of the optimized test protocol were then compared with the results of the non-optimized protocol.
Because the accommodation of people who have LBP was a motivating factor for this research, an effort was made to recruit participants with and without chronic recurring episodes of LBP, experienced when sitting and working at a computer. Presence of this LBP condition was used as a between-subjects factor in the statistical analysis of the results. Each participant completed the consent process approved by the University’s Institutional Review Board (IRB). Table 2 shows the number of participants broken down by LBP status, as well as the average age, height, body mass index (BMI), and arm length (shoulder to wrist) for each group.
| Previous Test; n=26 | Current Test; n=27 | |||
|---|---|---|---|---|
| LBP; n=18 mean (SD) | No LBP; n=8 mean (SD) | LBP; n=17 mean (SD) | No LBP; n=10 mean (SD) | |
Age* (yr) |
36.7 (13.6) |
25.9 (5.7) |
42.9 (13.4) |
27.0 (6.6) |
Height (cm) |
170.4 (9.0) |
170.6 (7.3) |
171.1 (7.4) |
171.9 (7.2) |
BMI* |
26.5 (5.7) |
24.1 (3.6) |
28.2 (5.2) |
24.1 (4.1) |
Arm Length (cm) |
65.6 (6.9) |
64.8 (2.3) |
64.6 (4.4) |
64.3 (3.3) |
| * indicates significant difference between LBP and NLBP groups within test cohorts (p<0.05) | ||||
RESULTS
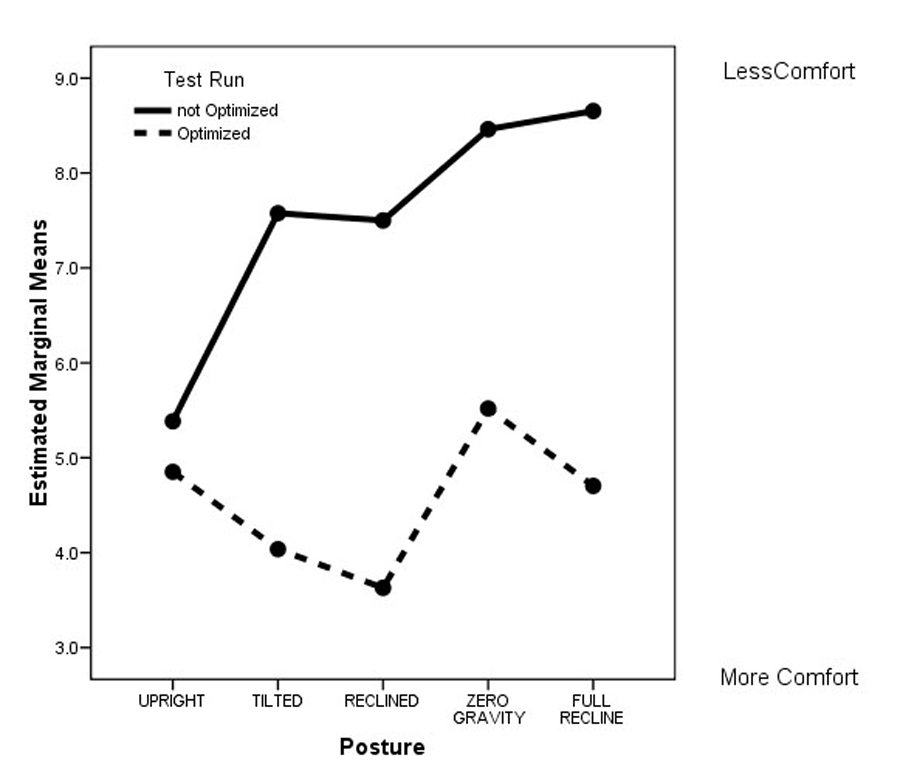 Figure 1: Mean OC scores for optimized and non-optimized test runs. (Click for larger view)
 The BPD data from the current test (analyzed using a general linear model, repeated measures statistical analysis with Huynh-Feldt correction) show a significant improvement in BPD scores by trial, F(2,39)=7.219, p<0.05. This indicates that the adjustments made between typing trials did help to improve user comfort. The OC scores for the optimized and non-optimized test runs were also analyzed using a general linear model, repeated measures statistical analysis. The analysis revealed not only a significant improvement in OC for the optimized test run, F(1,51)=17.556, p<0.05, but also a difference in the way the two groups were impacted by posture, F(4,204)=4.149, p<0.05. Figure 1 shows the different estimated marginal mean OC values for the optimized and the non-optimized test runs.
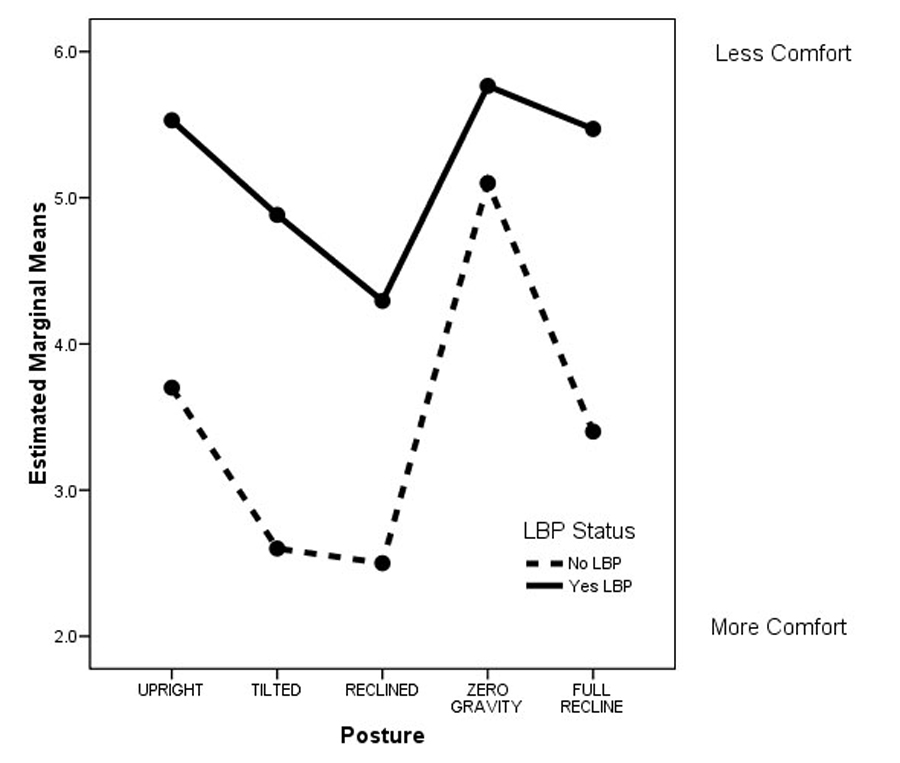 Figure 2: Mean OC scores by posture for people with and without LBP in the optimized test run. (Click for larger view)
Looking at the between-subjects effect of LBP status on OC showed that, while there was no difference in the way that the mean OC scores from the two groups were impacted by posture, the people with LBP (not surprisingly) tended to be less comfortable (mean OC=5.188) than those with no LBP (mean OC=3.460), F(1,25)=6.138, p<0.05. This relationship is demonstrated in Figure 2.
DISCUSSION
The results of the changes in OC comfort by postures indicate that optimization of the computer peripheral locations and the position of arm supports can significantly improve the mean OC scores for all alternative postures. Furthermore, optimization can significantly alter the perceived ranking of the alternative postures such that T and R postures are preferred relative to the typical U posture. Even though there were no significant differences in the way that the mean OC scores of people with LBP were impacted by posture, the fact that the mean OC scores for those with LBP were significantly higher (indicating less comfort) than the scores of those with no LBP warrants further investigation into the methods for optimizing posture and positioning for computer operators with LBP.
In conclusion, this research confirms the importance of accounting for the position of the computer peripherals and arm supports in computer workstations designed to accommodate operators in alternative working postures.
REFERENCES
- Bendix, T. (1994). Low back pain and seating. In R. Lueder & K. Noro (Eds.), Hard Facts about Soft Machines - The Ergonomics of Seating (pp. 147-155). London: Taylor & Francis Ltd.
- Haynes, S., & Williams, K. (2007). Product Review of Alternative Computer Workstations as Possible Workplace Accommodations for People with Chronic Low Back Pain. Technology and Disability, 19(1), 41-52.
- Grott, R. (2001). Lying Down on the Job: Case Studies in Working While Reclined. Paper presented at the RESNA 2001 Annual Conference: The AT Odyssey Continues, Reno, Nevada.
- Haynes, S., & Williams, K. (2008). Impact of seating posture on user comfort and typing performance for people with chronic low back pain. International Journal of Industrial Ergonomics, 38(1), 35-46.
- Borg, G. A. V. (1982). Psychophysical bases of perceived exertion. Medicine and Science in Sports and Exercise, 14, 337-381.
- Shackel, B., Chidsey, K. D., & Shipley, P. (1969). The Assessment of Chair Comfort. Ergonomics, 12(2), 269-306.
ACKNOWLEDGEMENTS
This is a publication of the RERC on Workplace Accommodations, which is supported by Grant H133E070026 of the National Institute on Disability and Rehabilitation Research of the U.S. Department of Education. The opinions contained in this publication are those of the grantee and do not necessarily reflect those of the U.S. Department of Education.
CONTACT INFORMATION
Scott Haynes, MBME
Center for Assistive Technology and Environmental Access
Georgia Institute of Technology
490 10th Street, NW
Atlanta, GA 30318
Phone: (404) 894-9156
E-mail: scott.haynes@coa.gatech.edu