Dining Experiences and the impact of accessibility information for people with disabilities: A pilot study
Dennis B. Tomashek, MS, Rachael Baumann, MS, Roger O. Smith, PhD
University of Wisconsin-MilwaukeeAbstract
This study tested the usability and a key aspect of consequential validity for the newly developed Access Ratings for Buildings (ARB) website app that provides Personalized Accessibility Information to users. A 2X2 design was used to collect both quantitative and qualitative data. Several important discoveries of how people with disabilities view dining out emerged from this study. The importance of pre-dining accessibility information was suggested.
INtroduction
Accessibility and dining out
Accessibility in the physical environment is a major barrier for many people with disabilities. The ADA (1990) was created to address this issue, but is limited to buildings built or renovated after 1992, and does not cover all areas of accessibility, such as availability of alternate menus for people with vision impairments, and sound and light levels (Poria & Reichel, 2011; Song Ee & Xinran, 2012). Limits of accessibility lead to limited participation (Law, 2002). People with disabilities often have fewer social relationships, and have more activities that take place at home (Law, 2002, Masse et al., 2012). Restaurants in particular are often places where people meet to socialize, yet many restaurants are not accessible to all individuals. A 2010 Survey found that only 48% of people with disabilities dined out more than 2 times a month, compared to 75% of people without disabilities(Kessler, 2010).
The Access Ratings for Buildings Project
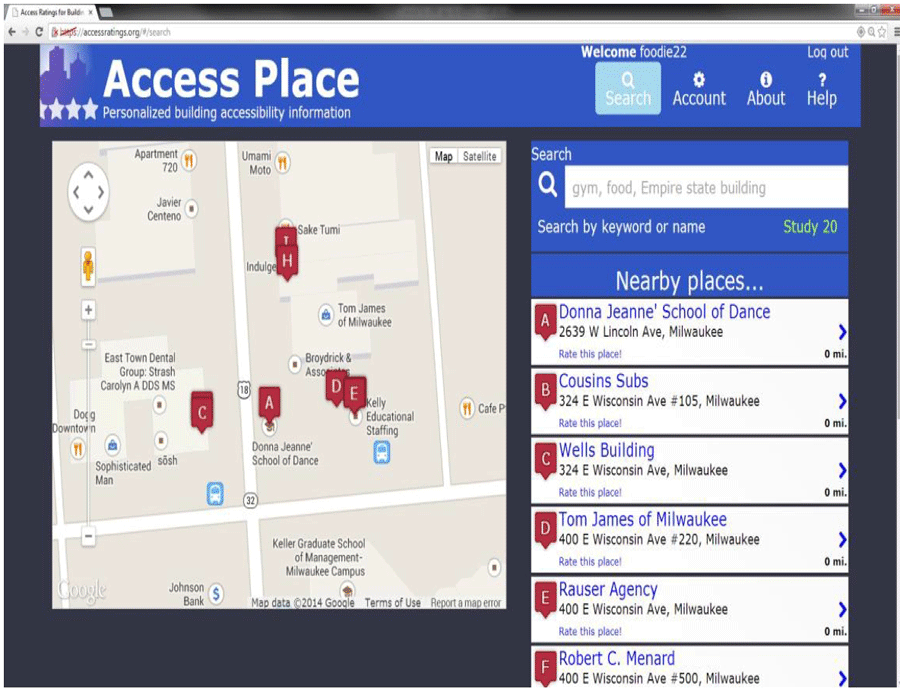 Figure 1: Screenshot of the ARB Website search page.
ARB does this through three methods; providing accessibility information about places to consumers, allowing consumers to add their own accessibility information, and expert evaluation. The unique feature of ARB is the ability to give consumers Personalized Accessibility Information (PAI). By creating a personal profile, including functional impairments, a person can receive information that is created either by other consumers who are most similar to them, or information provided by experts that has been tagged as being important to a person with their particular type or types of functional impairments.
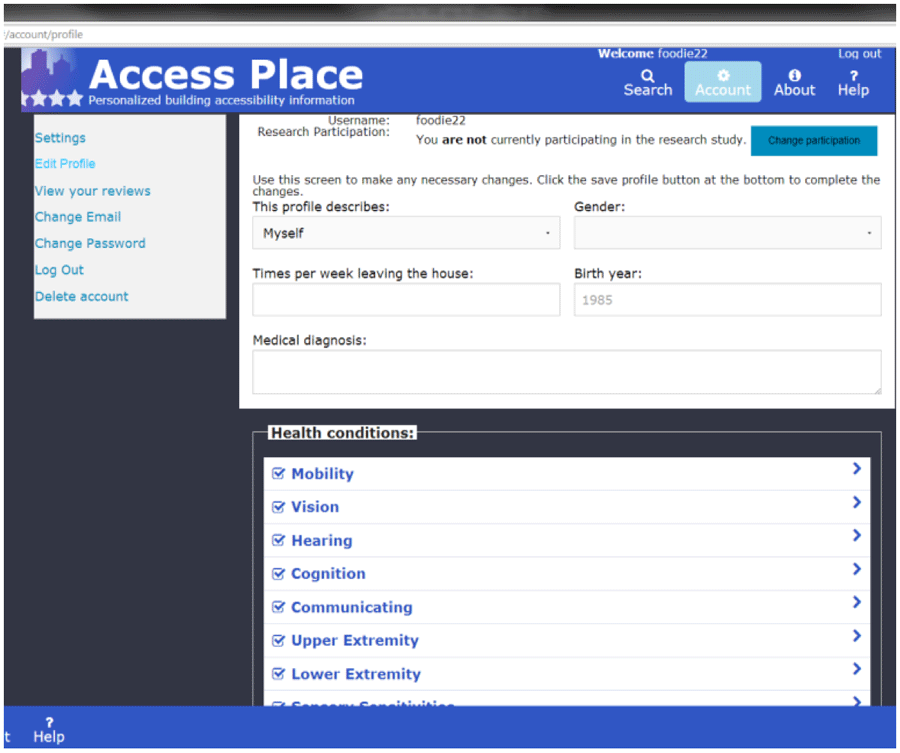 Figure 2: Screenshot of the AccessPlace Profile page.
For this study, participants used the web version of the ARB.
This Study
This study was designed to address whether people with disabilities who are more informed about accessibility would choose to attend more new restaurants than those who received general restaurant reviews (i.e., Yelp). Two groups (people with or without disabilities) were assigned to either the intervention (ARB) or control (Yelp) group. Quantitative and qualitative data was gathered to address questions regarding the number of new restaurants attended by those receiving PAI versus those receiving general restaurant reviews. This study was approved the by Institutional Review Board on campus.
Methods
Pre-Study Procedures
In order to assess the value of the PAI for restaurant selection, a number of restaurants first had to be assessed and populated with accessibility data. Twenty restaurants located near the campus were chosen. The restaurants were casual and fast food type establishments.
As ARB was first being used during this study, data within the ARB was populated in two ways. Four trained evaluators visited each of the 20 restaurants, and completed a 131 item evaluation, the Accessibility and Universal Design Information Tools (AUDIT). Additionally, two disability experts composed consumer reviews from the perspective of individuals with hearing, mobility, and vision impairments.
Data Collection Materials
Participants began with the Dining History and Preferences survey. Participants were asked to list 5-10 features that they valued most in a restaurant. Participants were also asked about their dining experience (e.g., frequency of dining out), and lastly were given the list of 20 restaurants, and asked to indicate the frequency of their dining at each. This was done to create an individualized list for each participant which would include five restaurants at which they had never dined and five at which they had dined. After receiving this list, the participants responded to the second survey, the Restaurant Selection survey. Each participant listed five restaurants that they selected to dine at based on the review information given to them. For each dining selection, participants were asked to list 5-10 features of the chosen restaurants which led to their decision. Participants were also given the opportunity to answer open-ended questions about their choices.
Participants
Thirty four participants, 17 with impairments, initially enrolled in the study. Of these, 25 completed the Dining History and Preferences survey. Sixteen (mean age = 41.8 (15.9)) of these also completed the Restaurant selection survey, of whom eight had a disability.
Data Analysis
| Comparison | Group 1 | Group 2 |
|---|---|---|
1 |
With Disability Intervention (5) Selected, M=2.56 SD (0.73) |
With Disability Control (4) Selected, M=1.50 SD (.52) |
2 |
With Disability Control (4) Selected, M=1.50 SD (1.29) |
Without Disability Control (4) Selected, M=1.50 SD (1.29) |
Two comparisons were conducted. The first compared people with disabilities across groups. It was expected that those using ARB would select more new restaurants. The second compared those with and without disabilities in the control (Yelp) group. It was expected that the people with disabilities would select fewer restaurants than people without disabilities. Because of the small N and non-continuous nature of the data, Mann-Whitney U tests were conducted.
Results
Quantitative Data
The findings were not statistically significant for either comparison.
Qualitative Data
Participants reported 15 different Most Valued Features of restaurants. For all study participants, “Cost/Value”, “Location/Proximity”, “Quality”, “Taste”, and “Accessibility” were listed most often. Among the participants with disabilities, “Accessibility” and “Location/Proximity” were listed most often, followed by “Quality”, “Cost/Value”, and “Where others go”. Table 2, below, gives the numbers for the top five features of the total sample and for those with disabilities.
Discussion
| Feature | Total Sample (n=16) | People with Disabilities (n=8) |
|---|---|---|
| Cost/Value | 14 (87.5%) | 5 (62.5%) |
| Location/Proximity | 11 (68.8%) | 8 (100%) |
| Quality | 9 (55.1%) | 5 (62.5%) |
| Taste | 9 (55.1%) | 4 (50.0%) |
| Accessibility | 9 (55.1%) | 8 (100%) |
| Where others go | 5 (31.3%) | 5 (62.5%) |
Several important findings about the experience of dining out for people with disabilities were discovered. The comparisons between the intervention and control groups for people with disabilities were not statistically significant. However there was a tendency toward the hypotheses, so this may be due to the small number of participants in each group, and the limited range (0-5) of the data. Importantly, the qualitative data presented insight into how people with disabilities prioritize restaurant dining features differently than those without. While both groups listed location/proximity, cost/value, and quality frequently, eight of the nine people with disabilities listed accessibility as an important feature. Additionally, while none of the participants without disabilities listed “where others go” as an important feature, five of those with disabilities did. This may indicate that people with disabilities are more dependent on others, and thus must go where others choose more often than people without disabilities, or that without prior accessibility information available, people with disabilities just go along with the crowd.
In addition to the surveys, all participants were offered the opportunity to dine at the restaurants they had chosen. Ten of these (eight with disabilities, five of whom were in the ARB intervention group) were then debriefed following their dining experienced. These interviews included questions about the ARB website and the usefulness of the site. While few said the information directly led to their restaurant selections, most did indicate that they would use this site in the future, especially when going to a new place. One person indicated that with prior information, he would be able to dine in at the restaurant more often, rather than not knowing whether the bathroom would be accessible, thus having to carry out instead. Several indicated that they felt the information had been personalized for them, and appreciated this feature. Others commented that while the accessibility information was good, it needed to be integrated with more overall restaurant features, such as menus and prices.
People with disabilities are at a disadvantage when attempting to dine out, and thus may be less inclined to go, becoming more isolated. However, the availability of searchable Personalized Accessibility Information could allow people with disabilities to be more independent, and have more opportunities to participate in the community. It is important that much of this information come from others who are experiencing the same functional impairments to grow a sense of community and shared experience.
References
Kessler Foundation. (2010). The ADA, 20 years later. Survey of Americans with disabilities. New York, Harris Interactive
Law, M. (2002). Participation in the Occupations of Everyday Life. The American Journal of Occupational Therapy, 56(6), p. 640-650.
Mâsse, L.C., Miller, A.R., Shen, J., Schiariti, V. and Roxborough, L. (2012). Comparing participation in activities among children with disabilities. Research Development and Disability, 33(6). p. 2245-2254
Poria, Y. & Reichel, A. (2011). Dimensions of hotel experience of people with disabilities: an exploratory study. International Journal of Contemporary Hospitality Management, 23(5), p.571-591.
Song Ee, K. and Xinran Y. L. (2012). The voice of tourists with mobility disabilities: insights from online customer complaint websites. International Journal of Contemporary Hospitality Management, 24(3), p. 451-476.
Acknowledgements
The AR-B Project is supported in part by the Department of Education, National Institute on Disability and Rehabilitation Research (NIDRR), grant number H133G100211. The opinions contained in this poster do not necessarily represent the policy of the U.S. Department of Education, and you should not assume endorsement by the Federal Government.