Development and Evaluation of a Programmable Alternating Pressure Seat Cushion
Tim D. Yang1–3, Kevin Kibler1,4, Chi-Wen Lung, PhD1,5, Yih-Kuen Jan, PT, PhD1–3
1Rehabilitation Engineering Laboratory, 2Kinesiology & Community Health, 3Computational Science & Engineering, 4Mechanical Science & Engineering, University of Illinois, Urbana-Champaign, IL, 5Creative Product Design, Asia University, Taichung, Taiwan
ABSTRACT
Alternating pressure has been shown to enhance the perfusion and viability of weight-bearing tissues in people with spinal cord injury (SCI). However, optimal inflation and cycle parameters for alternating pressure support surfaces remain undetermined. The goals of this study were to develop a programmable alternating pressure seat cushion with customizable cell configurations and to pilot test the cushion. Ischial skin perfusion was measured in response to three inflation protocols: constant pressure, alternating pressure with 10-min cycles, and alternating pressure with 5-min cycles. Skin perfusion was expected to increase with the presence of alternating and to increase as alternating cycle time decreased. One volunteer from the Rehabilitation Engineering Laboratory participated in the pilot test. Due to the sample size, statistical hypothesis testing was not performed; however, data trends appeared to support our expectations. Results merited a crossover study utilizing our customized cushion to perform hypothesis testing on the physiological effects of alternating pressure seating configurations in people with SCI.
INTRODUCTION
Pressure ulcer development is a leading complication following spinal cord injury (SCI). Treatment is reported to cost $16,800 per incident and $11 billion per year in the United States (Russo, Steiner, & Spector, 2008). Although the problem is well recognized, prevention remains elusive, as evidenced by the estimated 2.5 million pressure ulcers treated in acute care every year (Reddy, Gill, & Rochon, 2006).
While pressure ulcer etiology is not fully determined, prolonged pressure is an established prerequisite to ulceration. People with SCI are more likely to experience prolonged seating pressure as a consequence of reduced weight shifting that ensues from the disruption of sensory pathways (i.e., for pain and discomfort) and motor pathways. Thus, periodic pressure relief is recommended to increase skin perfusion and tissue viability by reducing the duration and magnitude of seating pressure (Dicianno et al., 2009; Kosiak, 1959).
In practice, traditional pressure relief strategies may not be appropriate or possible in every situation. Alternating pressure seat cushions may serve as a passive intervention by providing intermittent pressure relief to allow circulation to ischemic tissues Kosiak (1959) and has been supported in the literature as a technique to enhance skin perfusion (Jan, Brienza, Boninger, & Brenes, 2011; Jan, Brienza, Geyer, & Karg, 2008; Liao, Burns, & Jan, 2013). While numerous alternating pressure support surfaces exist in the market, optimal inflation and cycle parameters have yet to be uncovered.
Toward that end, two intermediate aims were achieved in this study. Our first aim was to develop an alternating pressure seat cushion to facilitate systematic testing of inflation parameters. For this cushion, every cell needed to be isolated, and each cell’s internal air pressure needed to be programmatically controlled. Our second aim was to pilot test the cushion in a preliminary evaluation of ischial skin perfusion versus alternating pressure seating configurations. Three inflation conditions were tested: constant pressure, alternating pressure with 10-min cycles, and alternating pressure with 5-min cycles. We expected that average skin perfusion would increase in response to alternating pressure when compared to constant pressure, and that average skin perfusion would increase as alternating cycle time decreased.
METHODS
Instrumentation
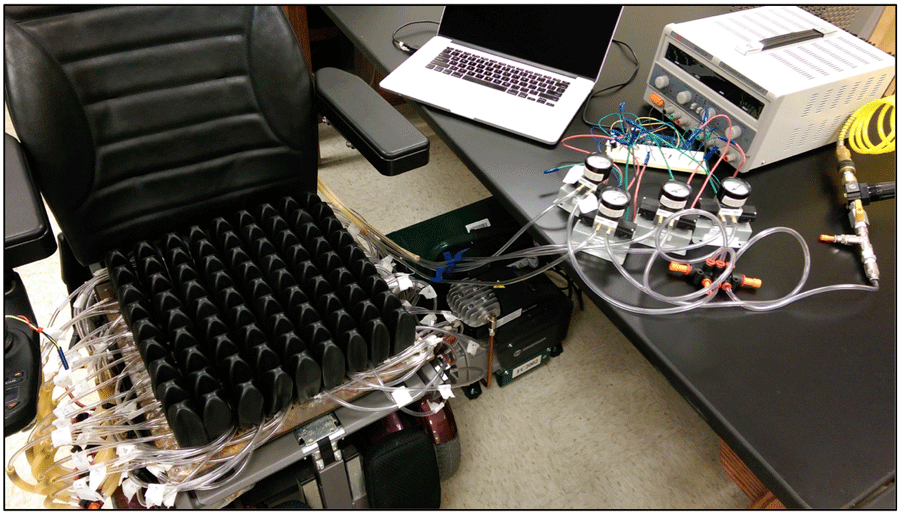 Figure 1: The programmable alternating pressure seat cushion that was developed and evaluated in this study
Cushion.
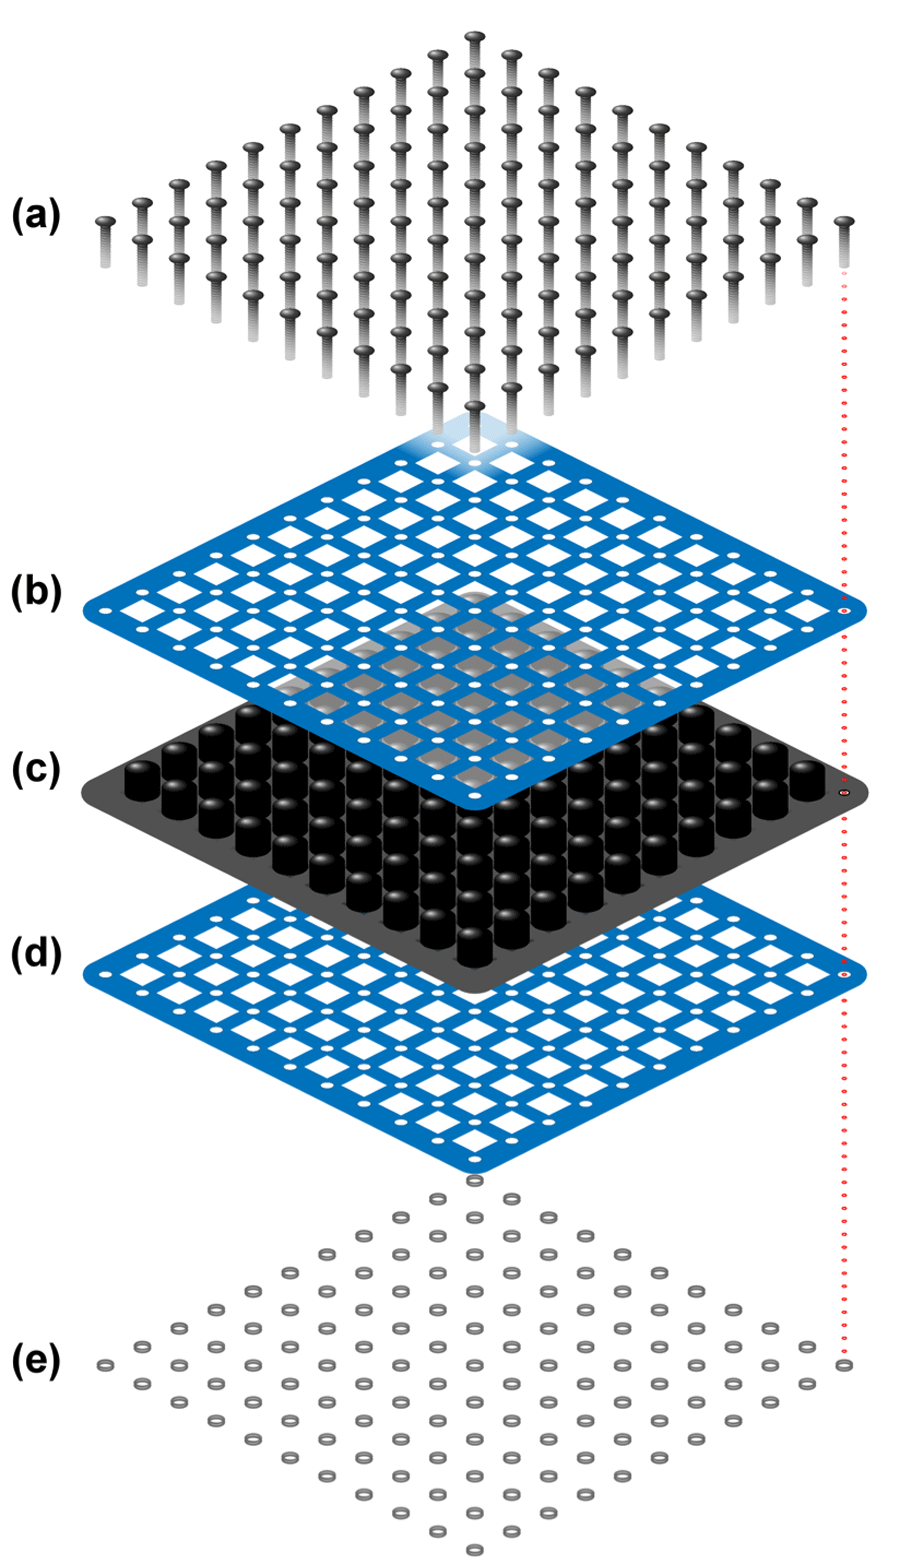 Figure 2: Exploded view of the modified cushion, in which two steel lattices were clamped over the airways of a ROHO cushion using nuts and bolts: (a) bolts, (b) steel lattice, (c) ROHO cushion, (d) steel lattice, and (e) nuts.
Controller.
In early prototype iterations, internal air pressures were regulated with manual pressure valves. As we approached the finalized lattice-clamp design, we began constructing an electronic controller to facilitate programmable air pressures (Figure 3). Four electropneumatic transducers (model IP-413-020; Omega Engineering, Inc.; Stamford, CT) were utilized to linearly convert 0–10 V signal inputs into 0–20 psi pressure outputs with ![]() 10 mmHg of accuracy. The transducers were powered with a variable power supply (model HY3005F-3; Precision Mastech Enterprises; Kwun Tong, Kowloon, Hong Kong). An Arduino microcontroller board (model Mega 2560 R3, Smart Projects SRL, Strambino, Italy) was used to send 0–5 V signals to the transducers. The Arduino’s 5 V limitation was acceptable since only low cell pressures were required. Pulse width modulation (PWM) Arduino outputs were integrated with resistor-capacitor low-pass filters as shown in Figure 3. Each PWM duty cycle value corresponded to a pneumatic output of approximately 2.03 mmHg,
10 mmHg of accuracy. The transducers were powered with a variable power supply (model HY3005F-3; Precision Mastech Enterprises; Kwun Tong, Kowloon, Hong Kong). An Arduino microcontroller board (model Mega 2560 R3, Smart Projects SRL, Strambino, Italy) was used to send 0–5 V signals to the transducers. The Arduino’s 5 V limitation was acceptable since only low cell pressures were required. Pulse width modulation (PWM) Arduino outputs were integrated with resistor-capacitor low-pass filters as shown in Figure 3. Each PWM duty cycle value corresponded to a pneumatic output of approximately 2.03 mmHg,
(1) |
|
| (2) |
Pneumatics.
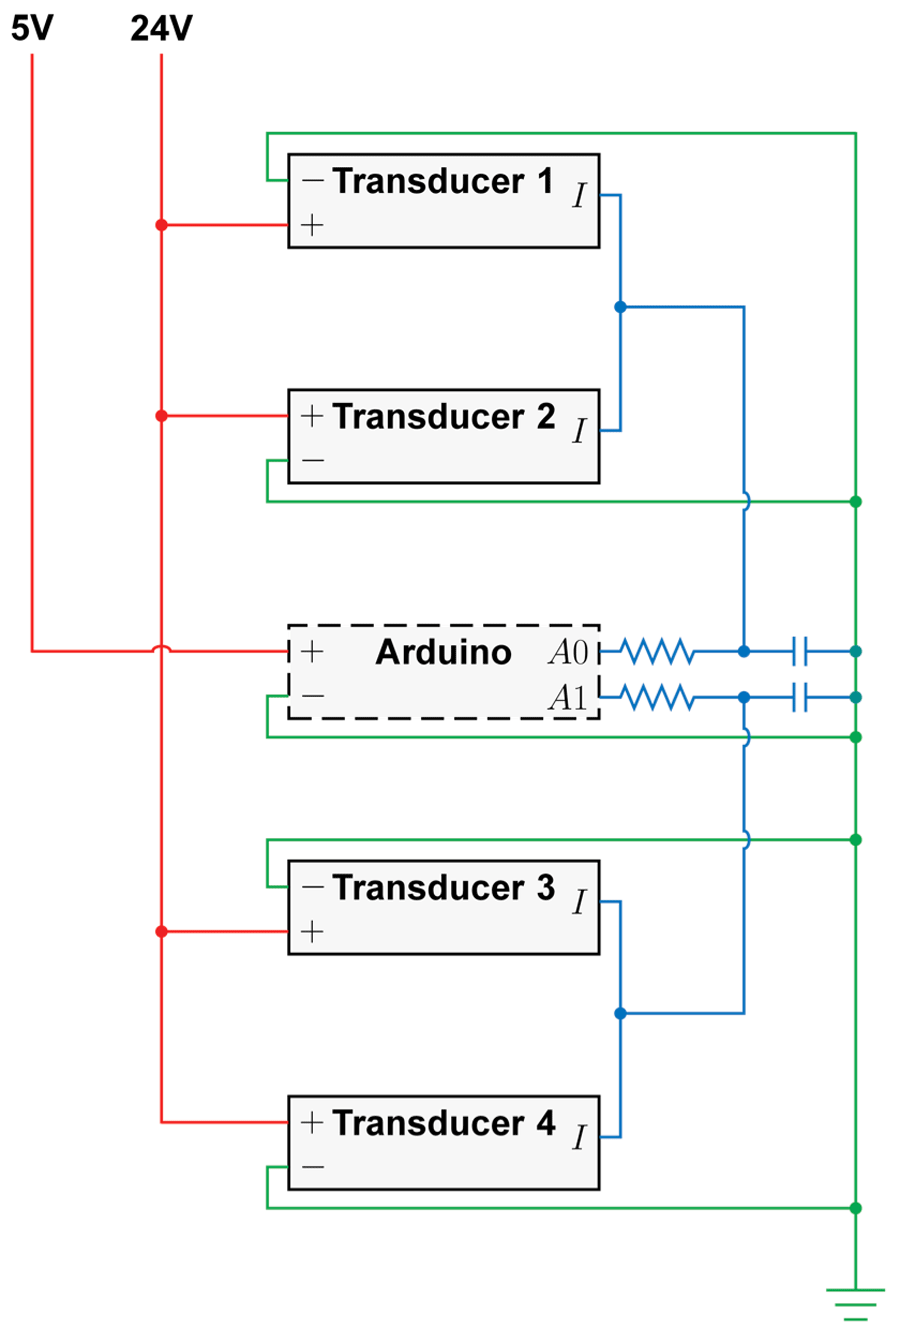 Figure 3: Circuit schematic of the controller’s electropneumatic transducers, microcontroller board, and resistor-capacitor filters.
![]() hose barb fittings onto small incisions near the base of each cell. These nozzles were then connected to the manifold outlets using PVC tubing, and unused manifold outlets were plugged. Air was supplied by a portable air compressor (model FC2002; Rolair Systems; Hustisford, WI).
hose barb fittings onto small incisions near the base of each cell. These nozzles were then connected to the manifold outlets using PVC tubing, and unused manifold outlets were plugged. Air was supplied by a portable air compressor (model FC2002; Rolair Systems; Hustisford, WI).
Participants
One member from the Rehabilitation Engineering Laboratory volunteered for the pilot evaluation. The participant did not present with a disability.
Procedure
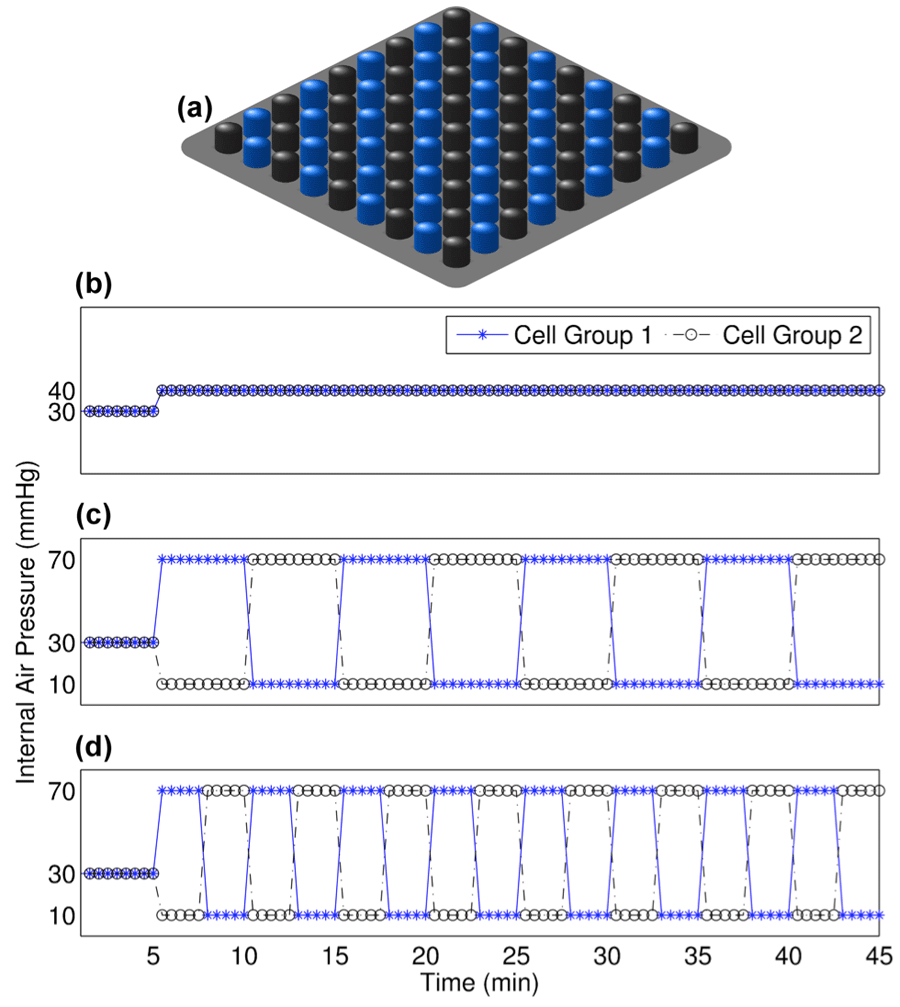
Three conditions were tested, in which two groups of cells were configured in a checkerboard pattern (Figure 5a). Each condition was preceded by a 5-min baseline period, in which both cell groups were inflated to a constant internal air pressure of 30 mmHg. The baseline period was followed by one of three 40-min testing periods. For protocol 1, the testing period consisted of a constant pressure configuration, in which both cell groups were inflated to a constant 40 mmHg over the entire duration (Figure 5b). For protocol 2, the testing period consisted of an alternating pressure configuration, in which cell groups were inflated to 10 mmHg and 70 mmHg over four 10-min cycles (Figure 5c). For protocol 3, the testing period consisted of another alternating pressure configuration, in which cell groups were inflated to 10 mmHg and 70 mmHg over eight 5-min cycles (Figure 5d). Each 45-min protocol was separated by 15-min breaks, approximating to a 3-hr procedure.
Analysis
RESULTS
DISCUSSION
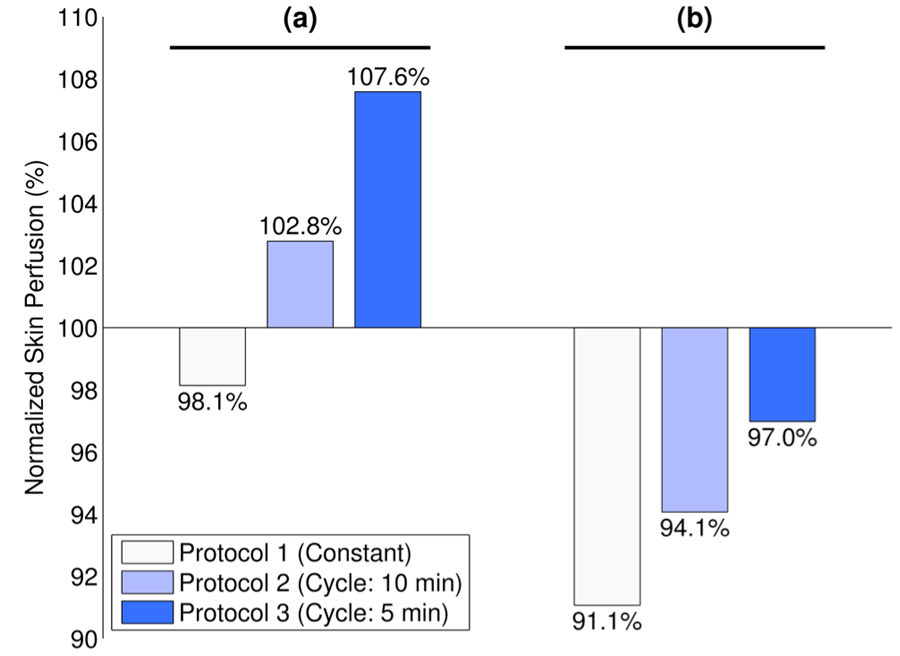
The pilot observations supported our expectations that skin perfusion would increase in response to the presence of alternating pressure, and that skin perfusion would increase as alternating cycle time decreased. When compared to constant pressure, skin perfusion during alternating pressure was on average 7.0% and 4.5% higher under the IT and anterior to the IT, respectively. When compared to 10-min cycles, skin perfusion during 5-min cycles was on average 4.8% and 2.9% higher under the IT and anterior to the IT, respectively.
These results indicated potential discriminability in skin perfusion between alternating pressure configurations, and they demonstrated the feasibility of using our customized cushion for systematic testing of alternating pressure parameters. Inflation pressures and cycle timings can be programmatically controlled using Arduino sketches, and air cells can be arbitrarily configured in up to four groups by rearranging manifold configurations. If more cell groups were to be desired in future experiments, additional transducers could be simply plugged into the circuit and tubing.
Forthcoming studies with our customized cushion may inform the development of optimized alternating pressure support surfaces to minimize the risk of pressure ulcers. Based on the ensuing evidence, one set of configuration parameters may be supported over others (e.g., number of cell groups, inflation levels of cell groups, cycle timings of cell groups, etc.). Furthermore, experiments may reveal unique optimal configurations per individual, informed by demography (e.g., injury type, injury level, injury duration, cardiovascular status, etc.).
In future work, participants with SCI will be recruited for a crossover study to assess physiological responses to alternating pressure seating configurations. Protocol ordering will be randomized. While the current study’s procedure included a 15-min washout period and 5-min baseline period for each protocol, a balanced design will further minimize potential carryover effects. In addition, modifications may be made to accommodate a customized cushion cover, which would facilitate the option of performing either covered or coverless cushion testing.
CONCLUSION
Our alternating pressure seat cushion facilitated programmatic control of alternating pressure parameters. Preliminary observations suggested that skin perfusion increased in response to alternating pressure and in response to decreased cycle times. Our modified cushion will be used in subsequent crossover studies to assess physiological responses to alternating pressure seating configurations in people with SCI.
REFERENCES
Dicianno, B. E., Arva, J., Lieberman, J. M., Schmeler, M. R., Souza, A., Phillips, K., . . . Betz, K. L. (2009). RESNA position on the application of tilt, recline, and elevating legrests for wheelchairs. Assistive Technology, 21(1), 13–22. doi: 10.1080/10400430902945769
Jan, Y. K., Brienza, D. M., Boninger, M. L., & Brenes, G. (2011). Comparison of skin perfusion response with alternating and constant pressures in people with spinal cord injury. Spinal Cord, 49(1), 136–141. doi: 10.1038/sc.2010.58
Jan, Y. K., Brienza, D. M., Geyer, M. J., & Karg, P. (2008). Wavelet-based spectrum analysis of sacral skin blood flow response to alternating pressure. Archives of Physical Medicine and Rehabilitation, 89(1), 137–145. doi: 10.1016/j.apmr.2007.07.046
Kosiak, M. (1959). Etiology and pathology of ischemic ulcers. Archives of Physical Medicine and Rehabilitation, 40, 62–69.
Liao, F., Burns, S., & Jan, Y. K. (2013). Skin blood flow dynamics and its role in pressure ulcers. Journal of Tissue Viability, 22(2), 25–36. doi: 10.1016/j.jtv.2013.03.001
Reddy, M., Gill, S. S., & Rochon, P. A. (2006). Preventing pressure ulcers: a systematic review. Journal of the American Medical Association, 296(8), 974–984. doi: 10.1001/jama.296.8.974
Russo, C. A., Steiner, C., & Spector, W. (2008). Hospitalizations related to pressure ulcers among adults 18 years and older, 2006.
ACKNOWLEDGMENTS
We thank Ann David for her input on the electronic controller and Permobil, Inc. for providing the power wheelchair. We thank Ling-Yi Wang, Yu-Chen Fa, and Yu-Xuan Huang for their assistance as summer interns.