development of The feedback controlled indentation system for assessing risk of pressure ulcers
Chuanhao Zhuge1, 2, Chi-Wen Lung, PhD2, 3, Deming Chen, PhD1, Yih-Kuen Jan, PT, PhD2
1Department of Electrical and Computer Engineering
2Rehabilitation Engineering Laboratory, Department of Kinesiology and Community Health
University of Illinois at Urbana-Champaign, IL, USA
3Department of Creative Product Design, Asia University, Taichung, Taiwan
ABSTRACT
Pressure ulcers are a common secondary complication in people with disabilities. With the increasing number of people suffering from pressure ulcers, it is urgent to develop efficient research methods and devices in order to understand etiological causes of such disease for developing proper prevention and treatment strategies. In this study, we introduce an efficient and robust indenter system with the purpose of performing reliable indentation tests for the study of mechanical etiology of pressure ulcers.
BACKGROUND
HARDWARE DESIGN
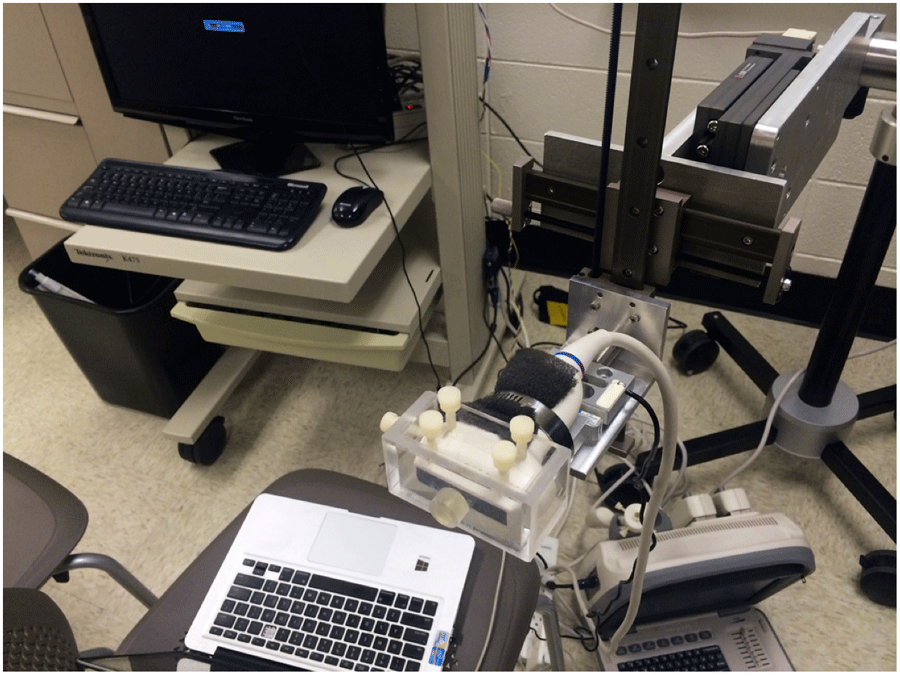
One of the problems researchers faced in experiments using the state-of-the-art indenter systems (Jan and Brienza, 2009; Jan et al, 2013) is that during a relatively long test time (such as skin blood flow test), test participants may intentionally or unintentionally move. Without compensation for these movements, the indenter may not apply correct force (or pressure) to the test participants and even more, it could fail to contact the test participants’ target body area. Therefore, the collected data were corrupted and must be discarded. The new design is to solve this problem and deliver more reliable experimental data. The indenter system consists of several main hardware components and some peripheral assistive devices, such as an ultrasound probe and a laser Doppler probe, which are connected on the tip of the indenter so as to acquire skin blood flow data and soft tissue deformation data for determining biomechanical properties of soft tissue. The system is controlled by LabVIEW Virtual Instrument program running on a personal computer, with a user friendly Graphical User Interface (GUI) control and data display panel. The hardware components include:
The Mechanical Frame
The mechanical frame holds the indenter. It (including the mechanical arms) has five degrees of freedom for adjusting position and angle. A cross positioner is used to help fine-adjust the position of load cell (Figure 1).
The Load Cell Sensor
The load cell sensor (UKS Series, LI-CHEN MEASURE, Kaohsiung, Taiwan) is used to acquire force data. It is capable of measuring maximum 20Kg force.
The Load Cell Sensor Amplifier
The load cell sensor amplifier (UEX-07, LI-CHEN MEASURE, Kaohsiung, Taiwan) amplifies and processes the faint signal from the load cell and displays the force data. It is capable of Analog-Digital (AD) conversion 120 times per second. The 0 – 20 mA electric data are sent via RS-232 port to the data acquisition device.
The Data Acquisition (DAQ) Device
The DAQ data acquisition device (USB-6218, National Instrument, Austin, TX, USA) takes in the analog signal at fast sampling rates with high accuracy. After ADC, the signal is sent to computer via a USB port and is further processed by LabVIEW program.
The Linear Actuator
The linear actuator is responsible for performing indentation. The stepper motor is connected to a driver case that controls the precise movement of motor via RS-232 port. The driver case is connected to the computer via USB port and is controlled by the LabVIEW program. Serialized data are sent using Virtual Instrument Software Architecture (VISA) standard, which provides the programming interface between hardware components and developing environments such as LabVIEW to control the movement of linear actuator.
SOFTWARE DESIGN AND ALGORITHMS
The PID Controller Implementation
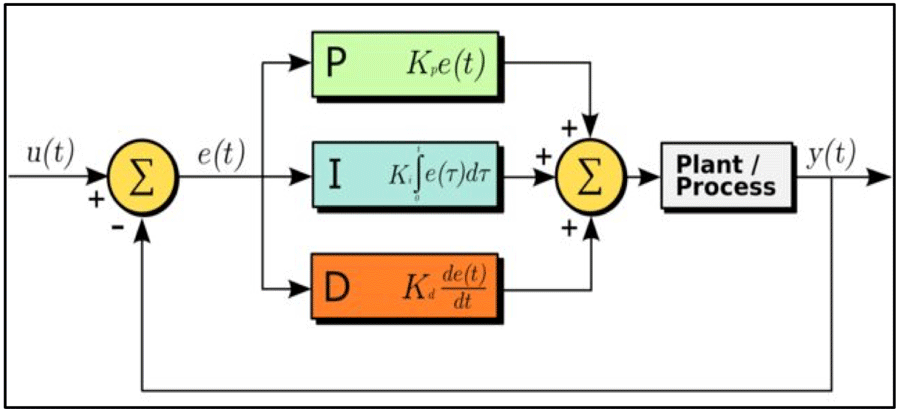
Currently, the PID control method is the most widely used algorithm used in industry. To make a simple explanation, PID controller uses three terms in the feedback control: proportional (Kp), integral (Ki) and derivative (Kd). The proportional controller (Kp) will have the effect of reducing the rise time and will reduce but never eliminate the steady-state error. An integral control (Ki) will have the effect of eliminating the steady-state error, but it may make the transient response worse. A derivative control (Kd) will have the effect of increasing the stability of the system, reducing the overshoot, and improving the transient response (“PID Control”). The block diagram below (Figure 2) illustrates the algorithm described above.
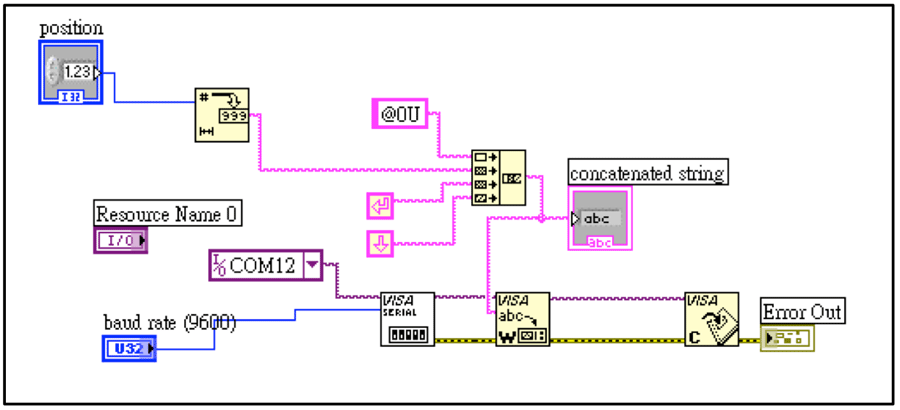
In software design, we use National Instrument VISA (NI-VISA) library, to build a sub Virtual Instruments (VI) to communicate with the linear actuator (stepper motor) driver. The input value is simply decimals denoting the movement of stepper motor. Thus the output of PID controller is ready to accept by the driver without much modification (Figure 3).
To implement PID control, we make use of several PID Control VIs provided by National Instrument (Figure 4). The PID control with auto-tuning VI implements the standard PID control algorithm as the following equation,
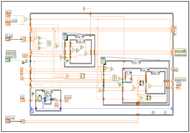
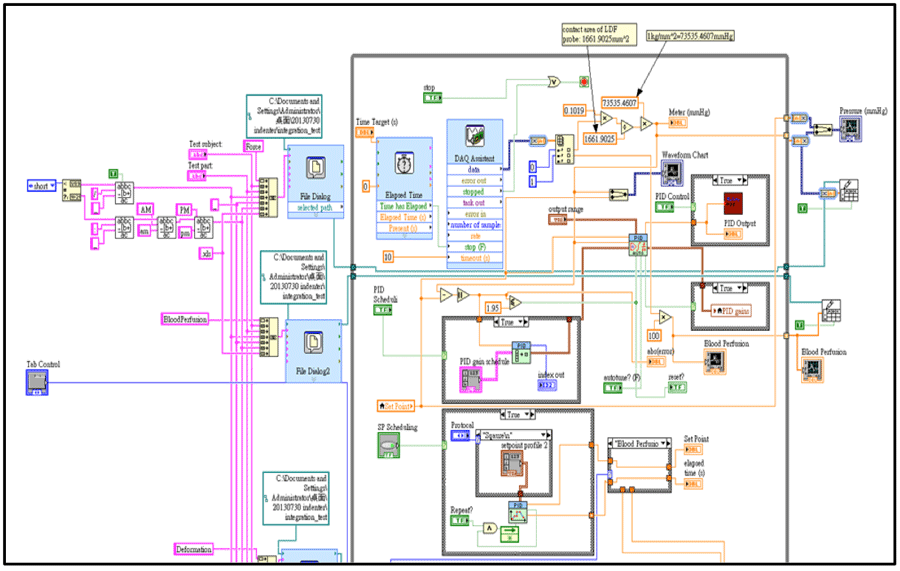
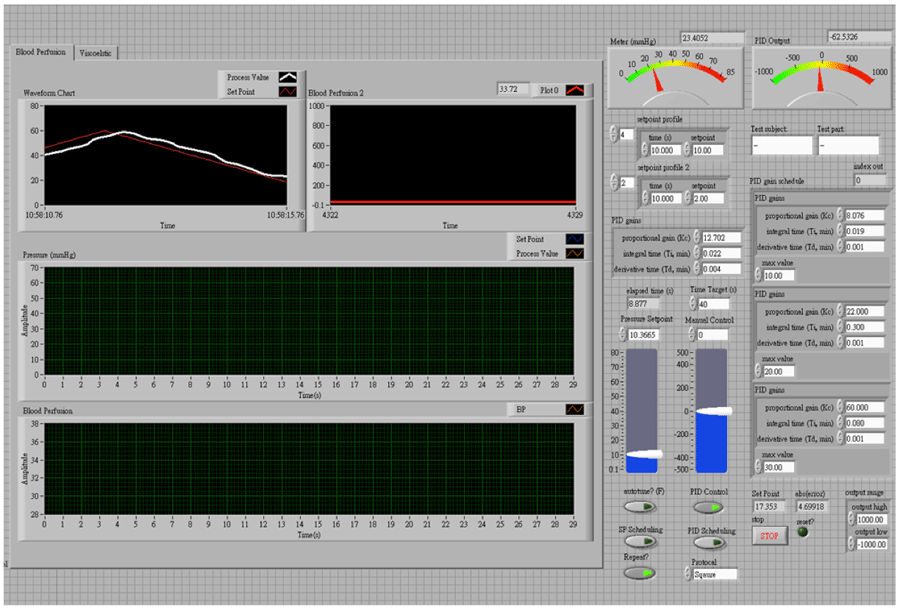
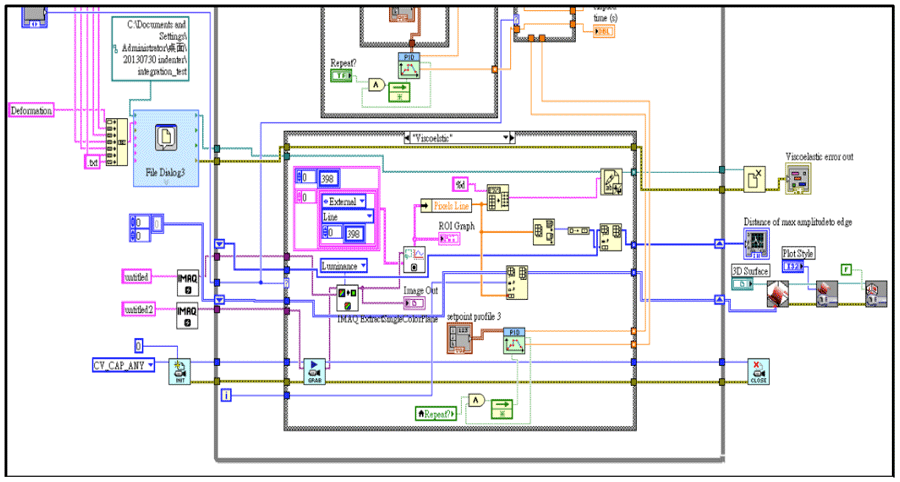
The block diagram of the program (LabVIEW source code) and the data display panel are shown in Figure 5 and Figure 6, respectively.
Where u is the output to be sent to the actuator driver; Kc, Ti (integral time), Td (derivative time) are PID parameters, SP is the set point and PV is process value, which is the force read from load cell in our case. To get an ideal performance, we need to tune the parameters and this would be illustrated as follows. The VI also provides auto-tuning functionality. Once we have established a stable controller, we can make use of an auto-tuning wizard to gain better parameters.
However, during the experiment, the auto tuning functionality does not always generate satisfactory parameters that meet our requirement, and may sometimes even cause the system to become unstable. For example, in experiments we observe that the parameter set it gives works stably when the set point is within some ranges such as 0 – 25 mmHg, but in other ranges or some specific values such as 30 or 50mmHg the system swings back and forth around set point value regularly (in some cases irregularly). Thus although we can use the auto-tuning wizard as a reference when improving the system, we would rely more on tuning the controller manually, which will be discussed later.
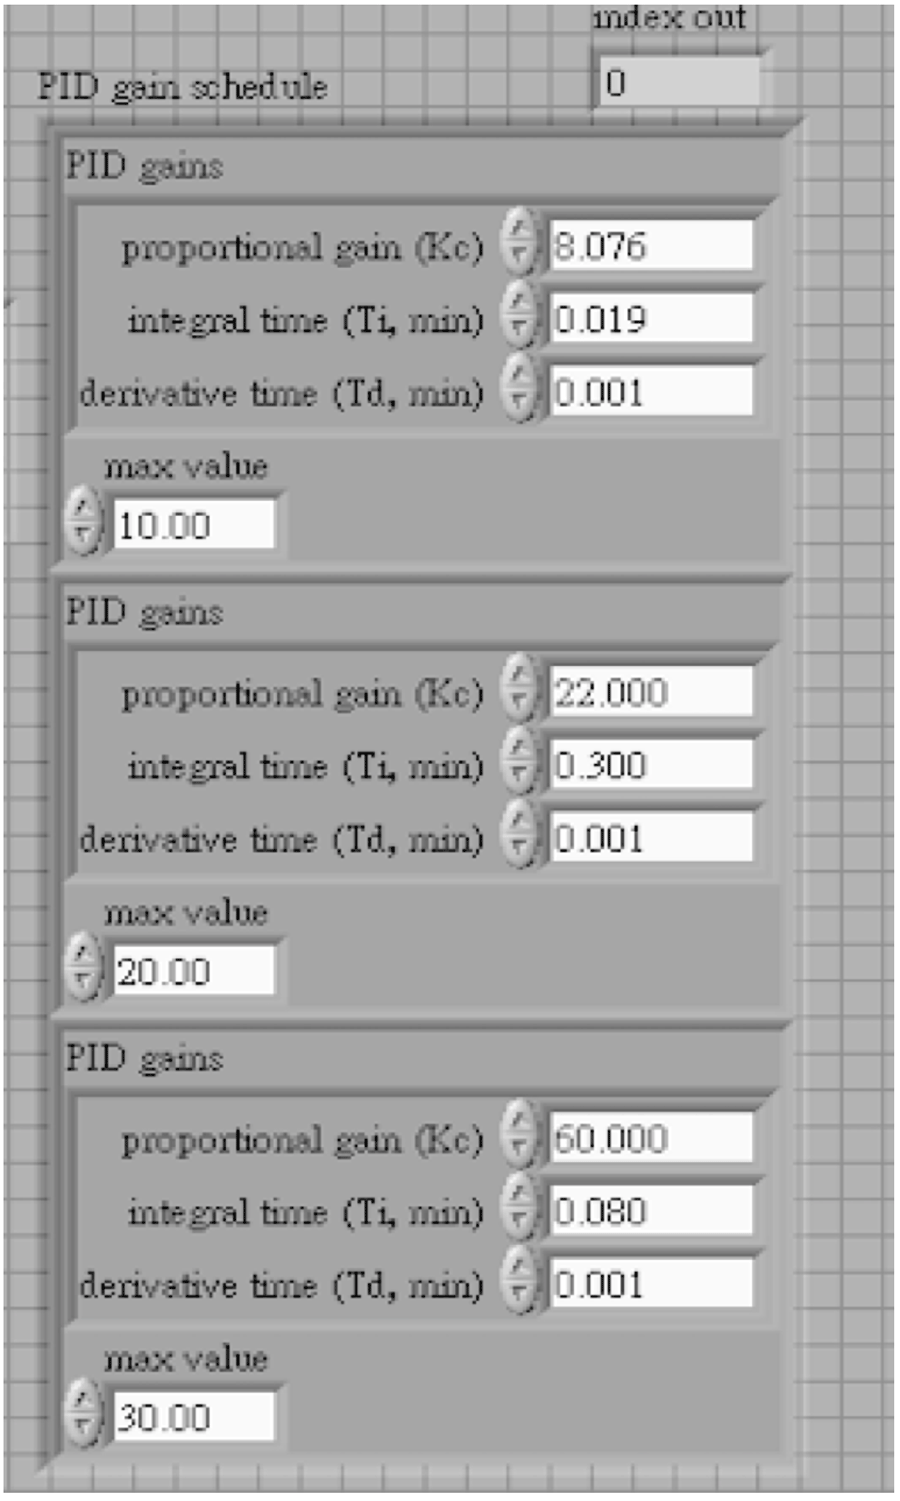
To improve the system, another technique known as gain scheduling based on the “state” of the system is introduced into the indenter system. An example is using different gain parameters once a certain set point has been reached, because the system responds differently once in steady-state (“Advanced Features in PID Tuning”). In our system, we define the state to be the difference between the set point and the process value (error). If the difference is small, we choose a conservative set of parameters to make the response smoother; else larger gains are used for faster response. In our case, when the error is less than 10mmHg, the system adapts Kc=8.076 Ti=0.019 Td=0.001 and when the error is between 10mmHg and 20mmHg, Kc=22 Ti=0.3 Td=0.001 is adapted, etc. The complete table (Table 1) and figure (Figure 7) is illustrated as follow.
| Error | Kc | Ti | Td |
|---|---|---|---|
| < 10 mmHg | 8.076 | 0.019 | 0.001 |
| 10 – 20 mmHg | 22 | 0.3 | 0.001 |
| 20 – 30 mmHg | 60 | 0.08 | 0 |
| > 30 mmHg | 86 | 0 | 0 |
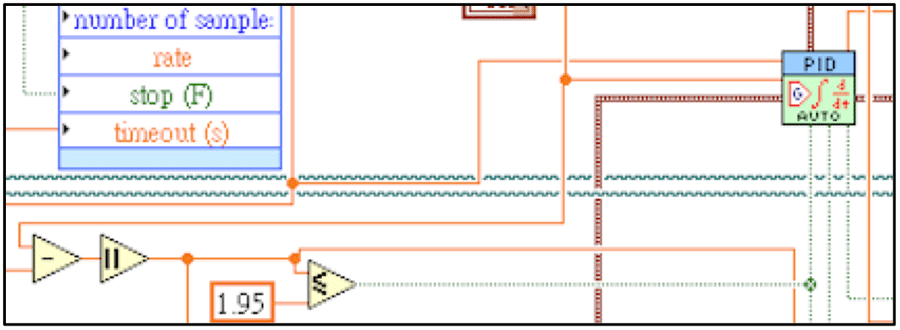
In the design, we make use of integral parameter that is effective for reducing steady state error, but a side effect of constantly integrating the error is “wind-up”, which introduces long delays in our system. The technique used to deal with this problem is to reset the accumulated error once the system is near the set point. In our system, we reset the PID controller once the error drops below 1.95mmHg (Figure 8).
Other components used in the program are DAQ Assistant for sampling the data from the USB-6218 DAQ device, file logging related VIs and image processing VIs for processing ultrasound image so as to obtain a time related deformation graph. Also, PID Setpoint Schedule VI is used to implement different test protocols. For example in blood perfusion experiment, we apply force ramping from 10mmHg to 60mmHg in 2 minutes, hold the pressure at 60mmHg for 6 minutes and offload the force by ramping down to 10mmHg the in 2 minutes and repeat the procedure. Other protocols can be implemented similarly.
PID Parameter Tuning
To obtain an ideal performance, the controller has to be tuned. The tuning is a process of determining the parameters that produce the desired output. In fast prototyping the indenter system, a mathematical model is not available; therefore parameter optimization is done by experimental method. There are several classical controller tuning methods including Ziegler-Nichols and Cohen-Coon methods etc. In tuning the indenter system, which is a closed loop system with feedback control, Ziegler-Nichols method is used.
The Ziegler-Nichols closed-loop tuning method allows us to use the ultimate gain value, Ku, and the ultimate period of oscillation, Pu, to calculate Kc. It is a simple method of tuning PID controllers and can be refined to give better approximations of the controller. We can obtain the controller constants Kc, Ti, and Td in a system with feedback.
| Kc | Ti | Td | |
|---|---|---|---|
| P | Ku /2 | ||
| PI | Ku /2.2 | Pu /1.2 | |
| PID | Ku /1.7 | Pu /2 | Pu /8 |
The advantage of this tuning method is that the design complication is easy, whereas the experiments are time consuming. In practice, the table above (Table 2) can be a guidance to help finding the ideal parameters but it is not necessarily true for every system. Thus, we need to adjust the parameters by observing performance when testing. Through tests, we find PID parameter set suitable for running skin blood flow experiment protocol, which is illustrated below (Table 3). Further trials are made to determine sets of parameters to be used in PID Parameter Scheduling introduced above.
| Kc | Ti | Td |
|---|---|---|
| 12.28 | 0.022 | 0.004 |
Ultrasound Image Acquisition and Processing
Ultrasound probe is also included in the indenter system for characterizing biomechanical properties of soft tissue. With the probe, we are able to measure the deformation of soft tissue related to the force applied. The distance of the skin surface and bone interface is changing according to the force and through M-mode ultrasound signals we can capture the deformation and map it as a function of time, so as to draw the force-deformation curve and obtain Young’s modulus (E), which is a traditional material constant to quantify elastic properties of soft tissue (Hayes et al,1972).
In the program, we use ADVision Toolkit to acquire image transmitted from ultrasound machine through USB port. Using IMAQ ExtractSingleColorPlane VI, we convert the image into gray scale image. Then we retrieve a single line of the image using Region of Interest (ROI) VI. The retrieval is consecutive and the ROI frames (in our case it is a line) are concatenated to form a graph of deformation. The graph is further converted to matrix and is to be processed using Matlab program (Figure 9).
TESTING OF THE SYSTEM
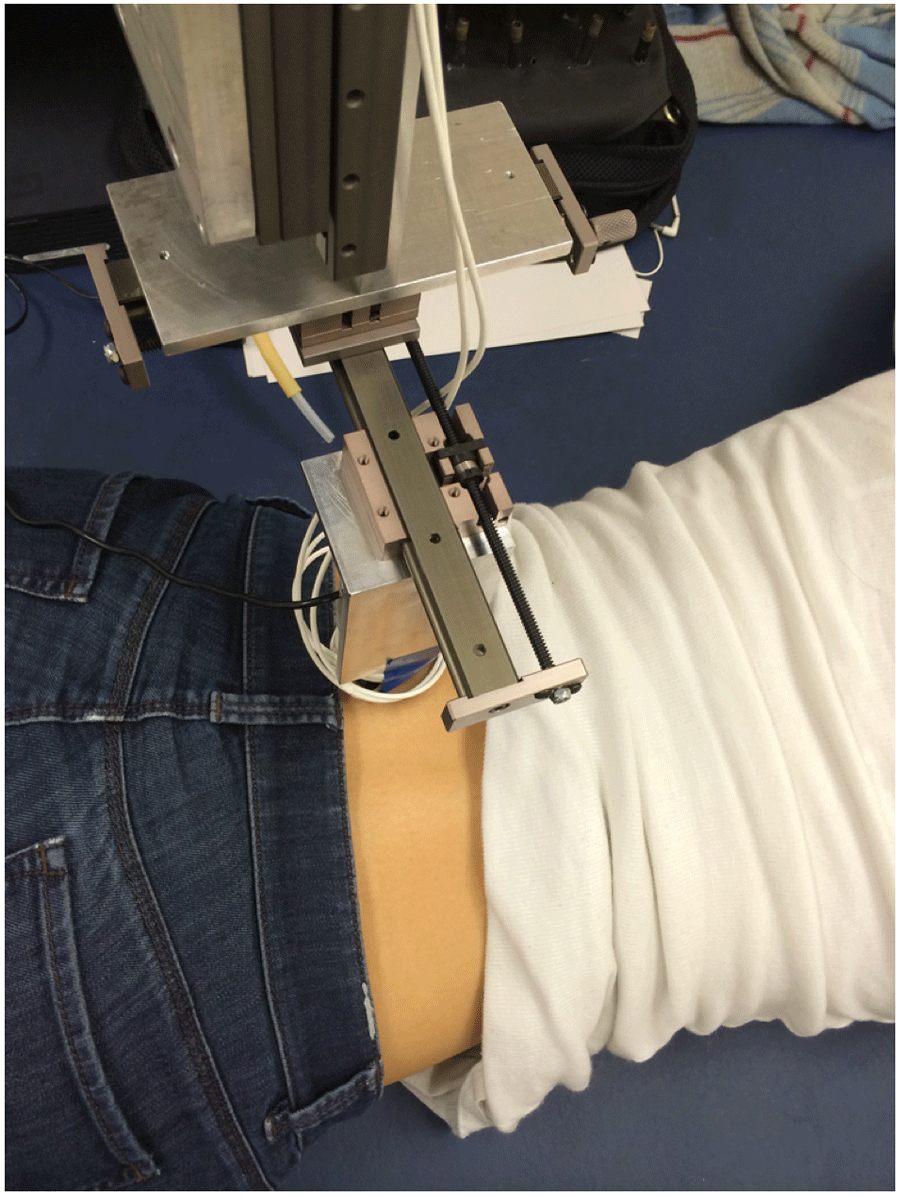
In order to test the functionality of the indentation system, we performed one primary application, which is measuring the blood perfusion change under indentation, because the experiment protocol allows us to see clearly how the indenter performs (compared to ultrasound elastography experiment). We attached a laser Doppler probe, which is 23mm in diameter, at the tip of the indenter to perform measurement. One participant, who is neurologically intact, was asked to lie in a prone position (Figure 10). The indenter was adjusted to point to the test participant’s body perpendicularly in order to perform indentation tests on the lower back and sacrum, which is the most common site for pressure ulcers (Salzberg et al, 1996).
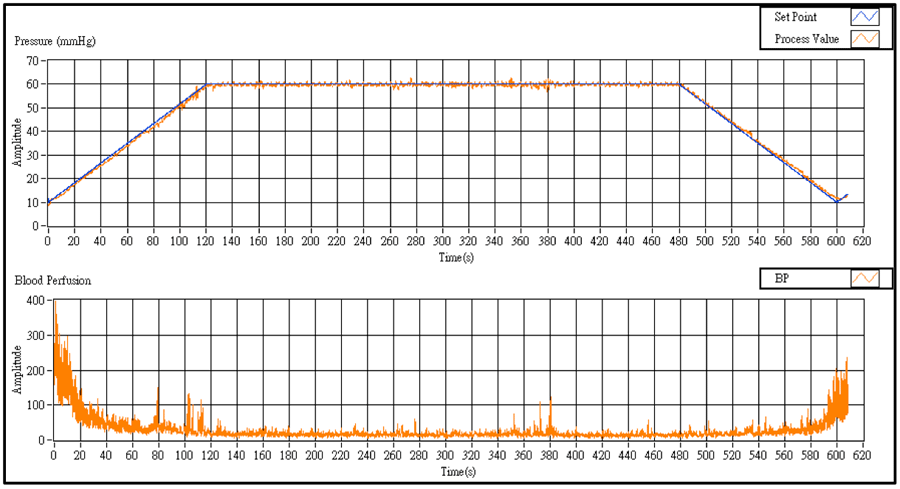
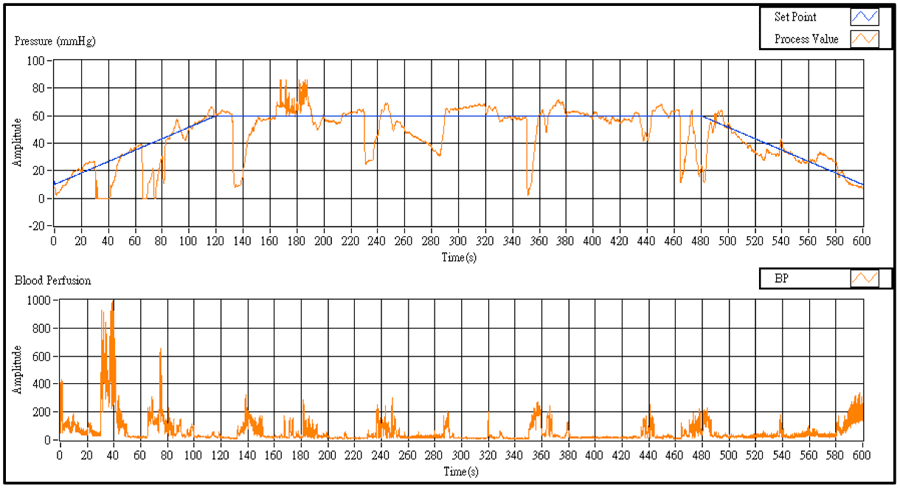
Test protocol was applying ramping pressure from 10mmHg to 60mmHg in 120 seconds, holding the pressure at constant 60mmHg for 360 seconds, and then offloading the pressure to 10mmHg for 120seconds. The sampling rate of blood perfusion meter is set to 1/0.02s. Three of the measurements are illustrated below.
In the first measurement, we asked the test participant to lie prone without any other intentional movements, so as to simulate the real test situation. We noticed that the participant might still move slightly and involuntarily during the experiment because of the subliminal intention to adjust the position. We observed in Figure 11 that the system was very stable and responsive, applying the target pressure to the participant as expected. Also, there was very little steady-state error between the set point and the process value, which was seen commonly on system without feedback control.
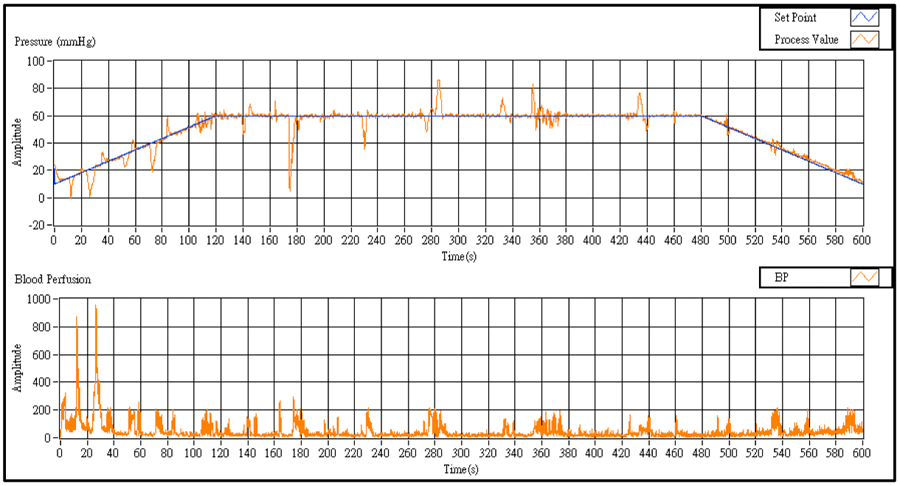
In the second experiment, we applied the same test protocol to the participant. The test participant was asked to move intentionally during the test this time. The movements include contracting the abdomen so that the lower back moves down, lowering the pressure; trying to roll to the left or to the right; trying to stretch up in order to increase the pressure. These movements essentially represent the situation that participants move vertically and horizontally. We found out in Figure 12 that with the intentional movements, there were fluctuations in the pressure applied, but these errors could be compensated responsively. The system was able to adjust itself to error state to correct state in a reasonably short time.
In the third control group experiment, we still asked the participant to move intentionally. Nevertheless this time we turned off the PID feedback control, for the purpose of observing the improvement of the feedback-controlled system. The system was controlled manually. In order to make the pressure go from low to high and high to low, constant output was set to the linear actuator during 0 – 120s and 480 – 600s. Also we manually adjusted the indenter once we found the error was too large. It is obvious that the system failed to deliver satisfactory performance, compared to test with feedback control. From Figure 13, we observed that not only it took much more time to compensate the participant’s intentional movement, but also large steady-state errors presented oftentimes. Furthermore, the system without PID feedback control requires the researcher to take care of it at all times when the experiment is being conducted, which is a major drawback compared to the feedback controlled system.
From the above results we can observe that the feedback-controlled indenter is capable of delivering target forces and remaining stable. If the participant moves, the controller can make compensation accordingly, yielding reliable data.
CONCLUSION AND FUTURE WORK
REFERENCES
Advanced Features in PID Tuning. (n.d.). Retrieved December 1, 2014, from http://www.ni.com/white-paper/2995/en/
Hayes, WC, Keer, LM, Herrmann, G, and Mockros, LF (1972). A mathematical analysis for indentation tests of articular cartilage J. Biomech. 5 541–51
Jan, YK and Brienza, DM (2009). Chapter 9: Tissue mechanics and blood flow factors in pressure ulcers of individuals with spinal cord injury. In: Gefen A, ed. The Pathomechanics of Tissue Injury and Disease, and the Mechanophysiology of Healing. Research Signpost, India, pp 241-259. (ISBN: 978-81-308-0314-2)
Jan, YK, Lung, CW, Cuaderes, E., Rong, D., & Boyce, K. (2013). Effect of viscoelastic properties of plantar soft tissues on plantar pressures at the first metatarsal head in diabetics with peripheral neuropathy. Physiological Measurement, 53-66.
Liang, O. (2013). Quadcopter PID Explained and Tuning - OscarLiang.net. Retrieved December 30, 2014, from http://blog.oscarliang.net/quadcopter-pid-explained-tuning/
PID Control. (n.d.). Retrieved December 1, 2014, from http://www.ni.com/white-paper/6440/en/#toc3
Salzberg, CA, Byrne, DW, Cayten, CG, van Niewerburgh, P, Murphy, JG, Viehbeck, M. (1996). A new pressure ulcer risk assessment scale for individuals with spinal cord injury. Am J Phys Med Rehabil., 75:96-104.
Wang, J. (2001). Development of a Compound Ultrasonic Device and In Vivo Biomechanics Assessment of Buttock Soft Tissue. Ph.D. Dissertation, University of Pittsburgh, Pittsburgh, PA, USA.
ACKNOWLEDGEMENT
The authors would like to thank all test participants for participating in these experiments. Also, we appreciate Yu-Chen Fa’s help in developing ultrasound image acquisition functionality.