A RETROSPECTIVE STUDY ON THE DEMOGRAPHICS OF CLIENTS WITHIN AN ASSISTIVE TECHNOLOGY CENTER
Taylor Duncan 1, Carmen DiGiovine 1,2,3, Theresa Berner 1,2
1Department of Occupational Therapy, The Ohio State University, Columbus, OH
2Assistive Technology Center, The Ohio State University Wexner Medical Center
3Biomedical Engineering Department, The Ohio State University
ABSTRACT
The purpose of this study is to define and describe the demographics of the population of individuals with mobility impairments seen within an assistive technology wheelchair clinic. A total of 560 individuals completed the quality assurance survey and were analyzed in the retrospective study through descriptive statistics. The results display the frequencies and percentages demographics of age, gender, device, and diagnosis. At this clinic, about half of the population are 55 or older and 75% are initially using a manual or power wheelchair. At baseline, younger individuals will more likely use a manual wheelchair while older adults use power wheelchairs. Those with moderate mobility limitation will initially use no device or a cane/crutch/walker, while those with more severe mobility limitation will initially use a manual or power wheelchair.
BACKGROUND
In order to prescribe the proper assistive mobility device to an individual, the service delivery process must be client centered. This is emphasized through the current concept of P4 medicine; that personal health care should be predictive, preventative, participatory, and personalized (Persch 2013). Not only does care need to be client centered, it also must be evidence based in order to support the decisions made within the service delivery process (Rappolt 2003). Examining the demographics of the population seen in an assistive technology wheelchair clinic allows treatment to become client centered and evidence based. It also provides an understanding of typical individuals seen in this setting and helps determine the most appropriate intervention.
In the research, there have been various studies analyzing demographics of individuals using assistive mobility devices. A study analyzing wheelchair consumers with spinal cord injury found that 54% of power wheelchairs and 97% of manual wheelchairs were customized (Hunt 2004). They also found that older adults as well as minorities with low socioeconomic status tend to have a standard power or manual wheelchair, not customized (Hunt 2004).
Research examining older adults discovered a variety of results when comparing their demographics to the assistive mobility device used, an example being that women who are older and have cardiovascular problems are more likely to receive standard manual or power wheelchairs. It was also found that age, gender, diagnosis, and living environment are related to the mobility device clients used (Karmarkar 2011). Similarly, another study analyzing veterans discovered that older veterans were more likely to receive a standard manual wheelchair while the younger received custom power wheelchairs (Hubbard et al. 2006). It also found that age, sex, and race are associated to the mobility device. Research evaluated by LaPlante and Kaye (2010) discovered that wheelchair users are more likely to be older females in poor health. Like the previous two studies, they also found that demographics such as gender, race, poverty and education can relate to the type of wheelchair utilized.
Although all of these studies examined the relationship between demographics and assistive mobility device, only one study does so through clients seen at a comprehensive assistive technology center. Demographic information is important in order to be more client centered and evidence based. These concepts are critical for assistive technology wheelchair clinics because the assistive mobility device prescribed will increase quality of life by improving client’s mobility and independence. Therefore, it is important to understand the clients regularly seen within this setting; this information would allow clinicians to understand their clientele and adjust their practice accordingly.
PURPOSE
The purpose of this study is to define and describe the demographic characteristics of the population seen within an assistive technology wheelchair clinic.
METHODS
Subjects
The individuals analyzed in this study were clients seen at the wheelchair clinic at The Ohio State University Wexner Medical Center Assistive Technology Center between July 1, 2011 and June 30, 2014.
Instrumentation
The instrument used was a survey consisting of de-identified demographics, the Quebec User Evaluation of Satisfaction with Assistive Technology (QUEST 2.0) and the Functional Mobility Assessment (FMA). The demographic information collected included year of birth, gender, race, language, diagnosis, year onset of diagnosis, device type and wheelchair manufacturer and model. Device type was divided into the subtypes of none, cane/crutch/walker, scooter, manual wheelchair, and power wheelchair.
Procedures
At the OSU Assistive Technology Center, the client was asked by the clinician to participate in the quality assurance program. If they accepted, they then completed a baseline survey at their initial evaluation and a follow-up survey four weeks after receiving their new mobility device. The de-identified information are then stored in a secure database maintained by the University of Pittsburgh. Approval for analysis of the data from the quality assurance programs as a retrospective study was obtained through The Ohio State University Institutional Review Board.
Data Analysis
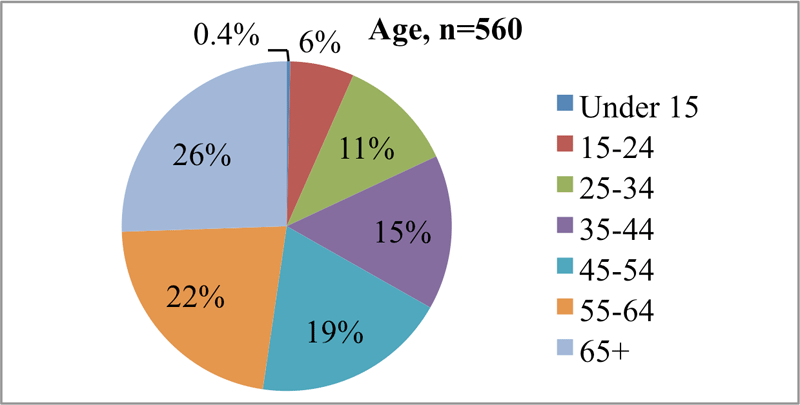 Figure 1: Percentage representing of age of clients seen within the wheelchair clinic
560 baseline surveys were completed within FYs 2012-2014 and extracted from the database. The demographic information was analyzed through descriptive statistics (frequencies and percentages). The demographics analyzed were age, gender, diagnosis and device. If the survey was missing data in a certain category, such as gender, then they were not included in the data analysis of that specific category. The “other” category consists of diagnoses that were not available in the list of 37 diagnoses listed in the database. Miscellaneous consist of diagnoses that were 3% or less. This includes amputation, congestive heart failure, degenerative joint disease, diabetes, Friedreich’s ataxia, Guillain Barre, Huntington’s disease, muscular dystrophy, obesity, osteogenesis imperfecta, Parkinson’s Disease, polyneuropathy, post-polio syndrome, spina bifida, and spinal muscular atrophy.
RESULTS
Age
Figure 1 displays the percentages of different age groups seen within an assistive technology wheelchair clinic. 48% of the individuals seen were adults 55 and older, while individuals 24 years and younger consist of only 6.4% of the population.
Gender
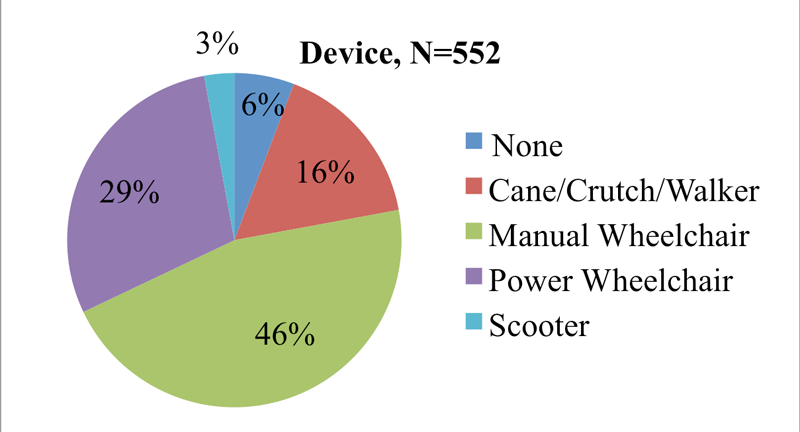 Figure 2: Percentage representing assistive mobility devices used initially by clients.
Gender was found to be almost completely even, with 49% of clients being male and 51% being female.
Device
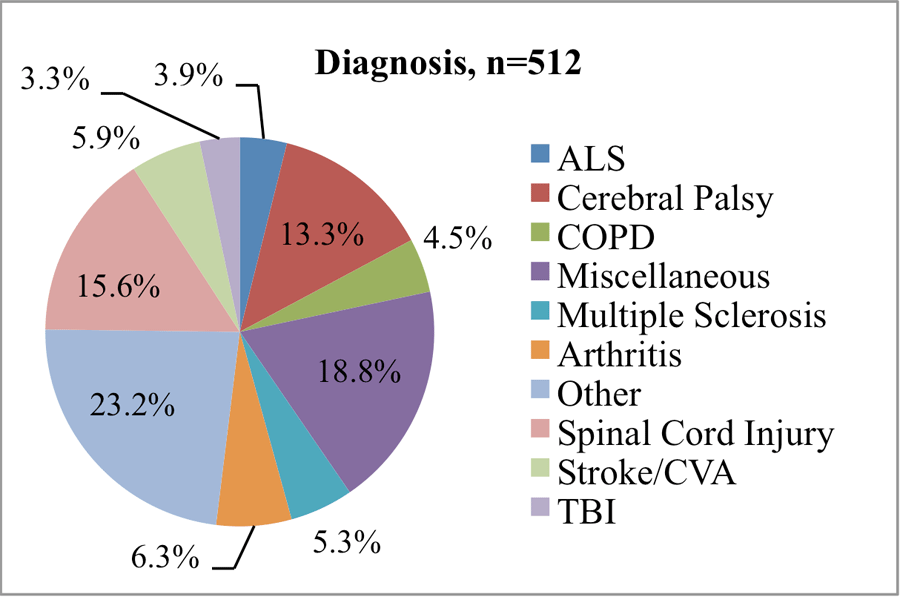
Figure 3: Percentage representing diagnoses seen within the wheelchair clinic.
Figure 2 exhibits the percentage of assistive mobility devices that clients initially used before undergoing the service delivery process. 75% of clients come to the clinic using a manual (46%) or power (29%) wheelchair. The other 25% consist of cane/crutch/walker (16%), scooter (3%) or no device (6%).
Diagnosis
Figure 3 displays the different diagnoses seen within the clinic. The two top categories are other at 23.2% and miscellaneous at 18.8%. The three highest categoriesfollowing are spinal cord injury (SCI) (15.6%), cerebral palsy (CP) (13.3%), and arthritis (6.3%).
Device and Age
Table 1 shows the frequencies and percentages when comparing age to assistive mobility device. The majority of individuals who came to the clinic with no device were 45 years old or older (86%). Similar characteristics were observed for cane/crutch/ walker (84%) and scooters (100%). For power wheelchairs, more than half of them (55%) were 55 years old or older. In contrast, over half of the clients initially coming to the clinic using manual wheelchairs are younger, between the ages of 25-45 (58%).
| None | Cane/Crutch/ Walker |
Manual Wheelchair |
Power Wheelchair |
Scooter | Total | |||||||
|---|---|---|---|---|---|---|---|---|---|---|---|---|
| No. | % | No. | % | No. | % | No. | % | No. | % | N= | % | |
| Under 15 | 0 | 0% | 0 | 0% | 2 | 1% | 0 | 0% | 0 | 0% | 2 | 0% |
| 15-24 | 1 | 3% | 1 | 1% | 21 | 8% | 10 | 6% | 0 | 0% | 33 | 6% |
| 25-34 | 0 | 0% | 2 | 2% | 47 | 19% | 14 | 9% | 0 | 0% | 63 | 12% |
| 35-44 | 3 | 10% | 11 | 12% | 47 | 19% | 24 | 15% | 0 | 0% | 85 | 16% |
| 45-54 | 7 | 24% | 22 | 24% | 51 | 20% | 22 | 14% | 3 | 19% | 105 | 19% |
| 55-64 | 8 | 28% | 23 | 26% | 38 | 15% | 43 | 27% | 5 | 31% | 117 | 22% |
| 65+ | 10 | 34% | 31 | 34% | 43 | 17% | 44 | 28% | 8 | 50% | 136 | 25% |
| Total | 29 | -- | 90 | -- | 249 | -- | 157 | -- | 16 | -- | 541 | -- |
Device and Diagnosis
Table 2 displays the frequency and percentages when comparing diagnoses to assistive mobility device. The top three diagnoses had no device are other (28%), arthritis (17%), and chronic obstructive pulmonary disorder (COPD) (17%). For cane/crutch/walker, the top three diagnoses were other (44%), miscellaneous (24%) and arthritis (13%). The top three for manual wheelchair are SCI (26%), other (21%), and CP (17%). With power wheelchairs, the top three are miscellaneous (22%), CP (17%), and other (16%) and for scooters, the top three were miscellaneous (29%), multiple sclerosis (MS) (21%), and other (21%).
| None | Cane/Crutch/ Walker |
Manual Wheelchair | Power Wheelchair | Scooter | Total | |||||||
|---|---|---|---|---|---|---|---|---|---|---|---|---|
| No. | % | No. | % | No. | % | No. | % | No. | % | No. | % | |
| ALS | 3 | 10% | 2 | 3% | 5 | 2% | 6 | 4% | 1 | 7% | 17 | 3% |
| CP | 1 | 3% | 1 | 1% | 38 | 17% | 24 | 17% | 1 | 7% | 65 | 13% |
| COPD | 5 | 17% | 5 | 6% | 5 | 2% | 6 | 4% | 0 | 0% | 21 | 4% |
| Misc. | 4 | 14% | 19 | 24% | 35 | 15% | 31 | 22% | 4 | 29% | 93 | 19% |
| MS | 0 | 0% | 2 | 3% | 5 | 2% | 16 | 11% | 3 | 21% | 26 | 5% |
| Arthritis | 5 | 17% | 10 | 13% | 5 | 2% | 8 | 6% | 1 | 7% | 29 | 6% |
| Other | 8 | 28% | 35 | 44% | 47 | 21% | 23 | 16% | 3 | 21% | 116 | 24% |
| SCI | 0 | 0% | 1 | 1% | 58 | 26% | 19 | 13% | 1 | 7% | 79 | 16% |
| Stroke | 2 | 7% | 4 | 5% | 17 | 8% | 6 | 4% | 0 | 0% | 29 | 6% |
| TBI | 1 | 3% | 0 | 0% | 11 | 5% | 5 | 3% | 0 | 0% | 17 | 3% |
| Total | 29 | -- | 79 | -- | 226 | -- | 144 | -- | 14 | -- | 492 | -- |
DISCUSSION
When looking at age, device, and diagnosis, the results show that clients initially seen within an assistive technology wheelchair clinic would more likely be 55 or older, currently using a manual or power wheelchair, and have a diagnosis that is not commonly seen (miscellaneous) or does not fit in a defined category (other). When assessing age and device, clients that initially use no device, cane/crutch/walker, power wheelchair and a scooter will more likely be older, while those who use manual wheelchairs will more likely be young to middle aged. Analyzing diagnosis and device shows individuals with moderate mobility limitation, such as COPD or arthritis, will initially use no device or a cane/crutch/walker, while those with more severe mobility limitation, such as SCI or CP, will initially use a manual or power wheelchair.
The study done by Karmarkar et al. (2011) also looked at the demographics of age, gender and diagnosis. In comparison to this study, they also discovered that gender was close to even, with females consisting of 44% females and 56% males. The average age in their study was 70.2 ± 8.6, which falls within the percentage of 48% individuals being age 55 and older found in this study. Similarities were also seen when looking at diagnoses. Their top five were SCI (19.9), stroke (11.9%), arthritis (11.3%), MS (10.0%), and COPD (7.6%). Excluding miscellaneous and other categories, the top five within this study were SCI (15.6%), CP (13.3%), arthritis (6.3%), stroke (5.9%), and MS (5.3%). Therefore, the only different diagnoses within the top five of these studies are COPD and CP.
Even though this study examined the basic frequencies and percentages of demographics, there is more that can be explored in the future with this data. One avenue is the influence of age on the type of device that is prescribed to a client. From the study, we see that younger individuals use manual wheelchairs while older adults have power wheelchairs. Is this influenced more by the mobility impairment or by age? Combining and analyzing device, age, and diagnosis data would help answer this question and provide a different way to look at the information. Also, separating data of first time clients from returning clients would provide an understanding of devices seen from newcomers and would take away the influence of the data of returning clients.
Study Limitations
There are two limitations associated with this study. One is within the survey, clients write their own diagnosis on a blank line, which leaves it to their own interpretation and understanding of their diagnosis. This leaves a wide range of what the client could describe as their diagnosis. Second, the data was collected as a part of a quality assurance program. Therefore, data entry was not as rigorous as it would be if it were a prospective research study. This was seen in the large number within the “other” category.
CONCLUSION
This study focused on demographics seen in the clientele at an assistive technology wheelchair clinic and found that the population would likely be 55 or older, currently using a manual or power wheelchair, and have the diagnosis that are not commonly seen (miscellaneous) or does not fit in a defined category (other). It was also discovered that older individuals would more likely initially have no device, a cane/crutch/walker, power wheelchair or scooter while younger individuals would use a manual wheelchair. Those with mild mobility impairments would more likely use no device or cane/crutch/walker while those with severe mobility impairments would use a manual or power wheelchair. The next step with this data is to review medical records in order to verify diagnoses and add post-intervention survey data. Including consumer input with demographic data improves the service delivery process by making it client centered and evidence based.
REFERENCES
Hubbard, S. L., Fitzgerald, S.G. Reker, D.M.. Boninger, M.L., Cooper, R.A., and Kazis L. E. (2006). Demographic characteristics of veterans who received wheelchairs and scooters from veterans health administration.” Journal of Rehabilitation Research & Development, 43(7), 831-844.
Hunt, P. C., Boninger, M. L., Cooper, R. A., Zafonte, R. D., Fitzgerald, S. G., & Schmeler, M. R. (2004) Demographic and socioeconomic factors associated with disparity in wheelchair customizability among people with traumatic spinal cord injury. Archives of Physical Medicine & Rehabilitation. 85(11), 1859–64.
Karmarkar, A. M., Dicianno, B. E., Cooper, R, Collins, D.M., Matthews J. T., Koontz, A., Teodorski, E. E., & Cooper R. A. (2011). Demographic profile of older adults using wheeled mobility devices. Journal of Aging Research doi:10.4061/2011/560358.
LaPlante, M. P., & Kaye H. S. (2010) Demographics and trends in wheeled mobility equipment use and accessibility in the community. Assistive Technology 22(1) 3–17.
Persch, A.C., Braveman, & B.H., Metzler, C.A. (2013). P4 medicine and pediatric occupational therapy. The American Journal of Occupational Therapy. 67(4) 383-388.
Rappolt, S. (2003). The Role of professional expertise in evidence-based occupational therapy. The American Journal of Occupational Therapy.57(5) 589-593.
AKNOWLEDGEMENTS
The authors would like to thank the clinicians at the OSU assistive technology wheelchair clinic who helped make this research possible.