Katherine Thanyamongkhonsawat1,3, Andrea Sundaram1,2, Rory Cooper1,2
1Human Engineering Research Laboratories, Department of Veterans Affairs, Pittsburgh, Pennsylvania; 2Department of Rehabilitation Science and Technology, University of Pittsburgh, Pittsburgh, Pennsylvania;
3Department of Biomedical Engineering, University of Texas at Dallas (UTD), Richardson, Texas
INTRODUCTION
There are about 3.6 million wheelchair users in the United States [1]. Wheelchair users are at risk of incurring pressure ulcers, which result from constant pressure on the skin by staying in one position for an extended amount of time [2]. The prevalence of pressure sores in the United States is about 13% and treatment can cost up to $70,000. Clinicians recommend periodic weight shifting (every 15-30 minutes) for pressure management and decreasing the chance of developing pressure ulcers, but it was found that only about 20.8% of manual wheelchair users (MWU) do so once an hour with the rest of the subpopulation having an even lower frequency [3]. Currently, there are various tools that provide regular reminders to perform pressure relief but fail to improve compliance or evaluate the effectiveness of the action [4].
The Manual Wheelchair Virtual Seating Coach (MW-VSC) is an extension of previous work on a Power Seat Function Virtual Seating Coach that implements intelligent reminders and evaluation of pressure relief actions [5]. It is a smartphone app that tracks the user’s center of pressure and reminds users to complete a pressure relief. It maps pressure with a system of strain gages under the seat pan. While this system performed well at measuring the user’s weight shifts, the materials and set up time for the implementation are cost prohibitive. A cheaper alternative to strain gages, such as quantum tunneling composites (QTCs) for 10 cents per pill, is desired.
QTCs are composite materials consisting of an insulating elastomeric binder and irregularly-shaped metal particles (100nm-500nm) dispersed throughout the binder without contact with other metal particles [6]. QTC resistance decreases with deformation, so they can act as pressure or force sensors. They utilize quantum tunneling. Uncompressed, they act as a perfect insulator with infinite resistance. When compressed, the metal particles are pushed closer together (with no contact), which increases the probability of an electron from one metal particle tunneling through the polymeric material to another metal particle, establishing conductance. QTCs demonstrate a relationship of logarithmic decay between resistance and amount of force applied; their resistance decreases sharply towards 0Ω to become a near-perfect conductor as deformation increases.
However, QTC are not well documented otherwise. Peratech suggests that the load that elicits maximum response from the QTC is 100N or about 22 pounds [7]. Hence, the objective of this study is to characterize QTC to evaluate their viability as pressure sensors for the MW-VSC.
METHOD
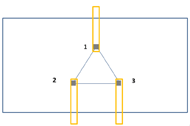
Setup


Data Collection
Five trials were conducted. Based on available weights, voltage was observed for the following forces in pounds 0, 2.2, 11, 21, 29.8, and 54.8. Weight was added about every 30 seconds; a button was pushed when a weight was added to obtain the timestamp of the addition. Then weight was removed (from 54.8 to 29.8 and so on) every 30 seconds for determination of hysteresis. One trial overall is 5.5 minutes. Data collection is stopped with the push of Button 2.
RESULTS


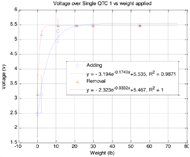
The lowest coefficient was 0.9622 with QTC Stack 2 for weight removal. A one-way ANOVA (α = 0.05) test on the averages over each QTC position, individual or stacked, revealed that there are no statically significant differences among them.
| QTC Position | Hysteresis | |
|---|---|---|
| Individual | Stacked | |
| 1 | 13.7096 | 9.8591 |
| 2 | 52.2823 | 17.9518 |
| 3 | 33.9639 | 23.1384 |
The data also demonstrated some hysteresis, shown in Table 1. Hysteresis for a QTC position was obtained by finding the difference between the area under the curve for when weight was added and for that of when weight was removed. When weight is being removed, there is a delay in the QTC uncompressing compared to compression from when weight was being added.
DISCUSSION
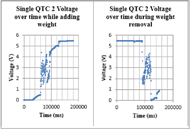
As seen in Figure 3, the raw data shows the QTCs’ response saturating under load, and hence they would be more ideal to be used as switches rather than sensors for pressure mapping. The flattened response after 21 pounds, or after about 90 seconds, is not ideal as wheelchair users exert over 50% of their body weight on the seat pan [8].
The extent of the hysteresis demonstrated may also affect the QTCs’ viability for the MW-VSC. Pressure would be continuously exerted in the seat pan, which would continuously compress the QTC pills unless there were additional structural components added such as springs or stands. With the pills in a continuous compressed state, the pressure tracking would be skewed for the next scheduled pressure relief action.
The data could have been affected by a variety of factors. The weight may not have been exactly centered, though this may more accurately reflect reality as everyone sits naturally with their unique pressure distribution. The copper tape used may also have minute deformations in the form of wrinkles that could affect the QTC’s voltage at a particular weight, so care is necessary to minimize wrinkles during placement of the strip. Based on the fluctuations, the lighter weights may not also have been steadily placed on the testbed, which detracts from wholly characterizing the QTC. In terms of the MW-VSC however, this is not as big of a problem since half of the average human weight is about 50 to 70 pounds. However, as aforementioned, the QTC response peaks after 21 pounds. Wood is also pliable compared to plexiglass, so using a wooden block as a base may have contributed to additional deformation of the QTC, so both blocks should be plexiglass. An advantage to using plexiglass, other than its stiffness, is that its transparency allowed a bird’s-eye view of the placement of the QTC and whether they shifted off the copper strip.
CONCLUSION
Quantum tunneling composites (QTCs) are polymer-metal composites with potential for various applications, particularly as pliable, small, inexpensive switches. While there were numerous limitations, the QTCs behaved as expected, as supported by the multiple curve fits with high correlation. The results support that QTC pills would not be viable as sensors for the MW-VSC. This system may work for children, who weigh less than adults. The resemblance to a switch is not desired, so other sensors should be considered. Other alternative sensors that may be used include: SEN-10-245 load sensors sold by SparkFun or the LPS25HB sold by STMicroelectronics, which can handle 40-50kg and 26-126kPa respectively [9,10].
Further characterization of the QTC pills include: settling time, time to return to uncompressed state, deformation characteristics and relationship between resistance and linear displacement.
REFERENCES
[1] Brault, M. W. (2012). Americans with disabilities: 2010. United States Census Bureau.
[2] Chou, R., Dana, T., Bougatsos, C., Blazina, I., Starmer, A. J., Reitel, K., & Buckley, D. I. (2013). Pressure ulcer risk assessment and prevention: A systematic comparative effectiveness review. Annals of Internal Medicine, 159(1), 28. Retrieved from http://www.ncbi.nlm.nih.gov/pubmed/23817702
[3] Y-s Yang, G-l Chang, M-j Hsu, & J-j Chang. (2009). Remote monitoring of sitting behaviors for community-dwelling manual wheelchair users with spinal cord injury. Spinal Cord, 47(1), 67-71. doi:10.1038/sc.2008.72
[4] Khan, A. A., Reuter, M., Phung, N., & Hafeez, S. S. (2016). Wireless solution to prevent decubitus ulcers: Preventive weight shifting guide, monitor, and tracker app for wheel chair users with spinal cord injuries (phase II). 1-6. doi:10.1109/HealthCom.2016.7749500
[5] Wu, Y., Liu, H., Kelleher, A., Pearlman, J., & Cooper, R. A. (2016). Evaluating the usability of a smartphone virtual seating coach application for powered wheelchair users. Medical Engineering & Physics, 38(6), 569-575. doi://doi.org/10.1016/j.medengphy.2016.03.001
[6] Lantada, A. D., Lafont, P., Sanz, J. L. M., Munoz-Guijosa, J. M., & Otero, J. E. (2010). Quantum tunnelling composites: Characterisation and modelling to promote their applications as sensors doi://dx.doi.org/10.1016/j.sna.2010.09.002
[7] QTC Pills [PDF]. Peratech.
[8] Shen, W., Parenteau, C., Roychoudhury, R., & Robbins, J. (1999). Seated weight distribution of adults and children in normal and non-normal positions. Annu Proc Assoc Adv Automot Med, 43, 383-397.
[9] SparkFun. Load Sensor - 50kg. Retrieved January 19, 2018, from https://www.sparkfun.com/products/10245
[10] MEMS pressure sensor: 260-1260 hPa absolute digital output barometer [PDF]. (2014, October). STMicroelectronics.
ACKNOWLEDGEMENTS
The contents of this paper do not represent the views of the Department of Veterans Affairs or the United States Government. This research was supported by the Human Engineering Research Laboratories at the University of Pittsburgh. It was made possible through the support of the National Science Foundation (NSF)’s grants EEC 0545865, 1063017, and 1262670, and also CDMRP grant W81XWH-17-1-0620.