Quantifying Vibration Characteristics of Focal Vibration Therapy
J. Rippetoe1,2, BS, H. Wang1,2, PhD, M. Ghazi2, PhD
1Stephenson School of Biomedical Engineering, University of Oklahoma, 2Department of Rehabilitation Sciences, University of Oklahoma Health Sciences Center
INTRODUCTION
Over the last decade, vibrations applied to the physical and rehabilitation medicine have been extensively investigated, including neurorehabilitation, a field where significant progress has been made in understanding both pathophysiology of the diseases and the influence of vibrational energy on the nervous system. Focal vibration (FV), a technique in which targeted vibration is applied to specific muscles or muscle groups, represents an innovative strategy to enhance balance and motor control across different neurological diseases. [1] FV indeed activates peripheral mechanoreceptors, leading to both short-term and long-term dynamic changes within somatosensory and motor systems, such that repeated applications may promote neuroplasticity with subsequent improvement in motor behavior. [1] Clinical and research evidences have shown satisfactory outcome of focal vibration as a useful tool in neurorehabilitation. Unfortunately, not much is known about the most effective levels of FV characteristics, i.e., frequency and intensity/amplitude. Different studies have used dissimilar FV devices with different FV characteristics, so it is difficult to make assessment across literature on the quality of the evidence. [1] A reasonable starting point for identifying useful FV characteristics is to learn from the commercial devices that deliver FV for therapeutic purposes. These devices are being used by individuals for rehabilitation therapy and pain relief. [2-3] Unfortunately, the few commercially available FV devices either do not report FV characteristics at all or do not report them in a clinically meaningful form. The objective of this paper is to measure the FV characteristics as delivered by these commercially available devices. To the best of our knowledge, this is the first attempt to quantify the FV characteristics of off the shelf FV therapeutic devices.
METHODS


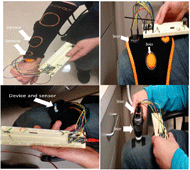
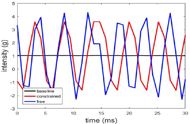
To find peak acceleration, an average of all the peaks in the sample window (1s) was taken (in the direction of the body). The average baseline acceleration (gravity) was calculated and subtracted from this to give the true acceleration delivered. Vibration frequency was estimated as follows: using zero-crossing rate detection, the period for all the waves in the sample window (1s) was estimated, averaged, and the inverse was taken to be the average frequency. Since each test was repeated three times, the above calculations were performed for each test and then an average was taken. The error in the period was calculated by multiplying the sampling rate by two and taking the inverse and was then added and subtracted to the period found for each device. To observe the effects of the error on the frequency, the period with the error was then inverted, which then found the frequency range of the device. The percent difference between average peak intensity from the free and constrained respectively was calculated to evaluate the difference of intensity between the two conditions. Furthermore, the advantages and disadvantages of each device was determined.
RESULTS
The lower and upper frequencies, intensities of both conditions, and percent difference from free to constrained of each device are shown in Table 1.
Device |
MyoVolt™ two-actuator |
MyoVolt™ three-actuator |
VibraCool® |
NOVAFON™ first setting with max intensity |
NOVAFON™ first setting with min intensity |
NOVAFON™ second setting with max intensity |
NOVAFON™ second setting with min intensity |
Lower Frequency (Hz) |
143 |
143 |
173 |
114 |
113 |
113 |
113 |
Upper Frequency (Hz) |
172 |
173 |
244 |
129 |
128 |
128 |
128 |
Free Mean Peak (g) |
2.904 |
0.727 |
3.064 |
2.871 |
1.379 |
2.191 |
0.938 |
Constrained Mean Peak (g) |
1.685 |
2.250 |
2.847 |
2.055 |
1.365 |
1.520 |
0.980 |
Percent difference from Free to Constrained (%) |
-42 |
210 |
-7 |
-28 |
-1 |
-31 |
4 |


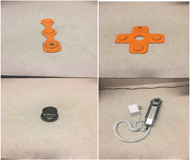
MyoVolt™ two-actuator and three-actuator, VibraCool® Extended, and both modes with each intensity setting of NOVAFON™ for both the free and constrained conditions. We also summarized the advantages and disadvantages of each device are shown in Table 2 based on our experiments. The MyoVolt™ devices had a comfortable intensity level and due to the straps and wraps, could be applied to various parts of the body and held in place without having to hold them, but they were the most difficult to don and doff and the sleeve to hold the two-actuator device was very tight and uncomfortable (Table 2). VibraCool® was found to be the easiest to don and doff and with its strap could also be held in place without having to hold it in place, but the intensity from this device was the strongest and could be uncomfortable. NOVAFON™ had the greatest user friendliness and could be applied easily over the body. However, it was not wireless, did not have any straps thus, making it difficult to be able to perform any other tasks while the vibration is applied, and is difficult to reach certain parts of the body without assistance.
Device |
MyoVolt™ devices |
VibraCool® |
NOVAFON™ |
Advantage |
Comfortable intensity level Straps make it easy to accomplish other tasks while wearing device |
Easy to don and doff Straps make it easy to accomplish other tasks while wearing device |
User friendly Easily applicable to muscles within an arm’s reach |
Disadvantage |
Difficult to don and doff Uncomfortable Sleeves |
Strong intensity which may lead to discomfort |
Not wireless No straps to hold in place, which makes it impossible to accomplish other tasks while wearing Cannot reach certain parts of body without assistance |
DISCUSSION

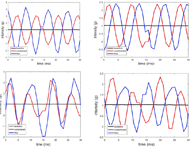
A few limitations existed in this study. The MyoVolt™ devices’ actuators were not oscillating at the same time, meaning that their intensity may have either added to or subtracted from each other. Thus, the intensity peaks were either larger (constructive interference) or smaller (destructive interference) than the actual intensity of a single actuator. This could account for the different sized peaks that were observed (Figure 5). Another limitation was that the accelerometer’s sampling rate may have been too low for the accelerometer to have properly found the correct intensities and frequencies of each device. Despite the limitations of our study, we were able to find that some of the devices matched the manufacturer’s specifications. The VibraCool® Extended’s frequency was within the specifications (175 to 250 Hz) from the manufacturers. [4] We also found that the manufacturer’s specified frequency of 120 Hz [5] was within our range of frequency of the first mode of the NOVAFON™ Pro. However, the frequency of both MyoVolt™ devices did not match the manufacturer’s specified frequency of 120 Hz [3] and instead differed by about 40 Hz (Table 1). Furthermore, the second mode of the NOVAFON™ Pro did not match the stated frequency from the manufacturer of 60 Hz [5] and alternatively, differed by about 60 Hz (Table 1). Although we were able to directly compare the frequencies of each device from the manufacturer’s specifications, we could not directly compare the intensities because of either a lack of information given from the manufacturers or that they only stated the devices displacement. Nevertheless, we were able to directly compare the intensities from the free to constrained conditions. Typically, intensity decreases, but in some cases, intensity can increase from free to constrained. The intensity decreased from the free to constrained conditions in all cases except the three-actuator MyoVolt™ device and the second mode with minimum intensity setting of the NOVAFON™ Pro. Possible causes are multiple actuator interactions, structural damping, and dynamics of the fabric material used. Thus, our data highlights the need for more investigations into FV and the commercially available FV devices.
CONCLUSION
Manufacturer specifications are not always accurate, such as the frequency or displacement. Since the body can change the intensity when the device is applied, it is inaccurate to state just the free vibration intensity. Furthermore, multiple pod devices like MyoVolt™ do not deliver consistent intensity since they may interfere with each other. The future of this work is to further evaluate the commercially available devices with an accelerometer that has a higher sampling rate to achieve a better estimate of the frequency and intensity. These findings will help in the development and evaluation of future FV devices, help the clinicians accurately deliver prescribed vibration therapy, and help researchers better understand the effect of vibration in neurorehabilitation.
REFERENCES
[1] Murillo, N., Valls-Sole, J., Vidal, J., Opisso, E., Medina, J., & Kumru, H. (2014). Focal vibration in neurorehabilitation. European Journal of Physical and Rehabilitation Medicine, 50(2), 231–42. Retrieved from http://www.ncbi.nlm.nih.gov/pubmed/24842220
[2] Aiyegbusi, A. I., Duru, F., Akinbo, S. R., Noronha, C. C., & Okanlawon, A. O. (2010). Intrasound therapy in tendon healing: is intensity a factor? Open Access Rheumatology : Research and Reviews, 2, 45–52. Retrieved from http://www.ncbi.nlm.nih.gov/pubmed/27789997
[3] Cochrane, D. J. (2017). Effectiveness of using wearable vibration therapy to alleviate muscle soreness. European Journal of Applied Physiology, 117, 501–509. https://doi.org/10.1007/s00421-017-3551-y
[4] Baxter et al. (2016). 0095789. http://appft.uspto.gov/netacgi/nph-Parser?Sect1=PTO1&Sect2=HITOFF&d=PG01&p=1&u=%2Fnetahtml%2FPTO%2Fsrchnum.html&r=1&f=G&l=50&s1=%2220160095789%22.PGNR.&OS=DN/20160095789&RS=DN/20160095789
[5] NOVAFON po | NOVAFON. (n.d.). from https://novafon.com/us/detail/index/sArticle/55