Keerthana Kalliat, Patricia Karg, David Brienza, Sandra Guzman, Jenna Freedman, Alexandra Delazio
University of Pittsburgh, Department of Rehabilitation Sciences and Technology (Pittsburgh)
INTRODUCTION
Wheelchair seat cushions are designed not only to provide comfort, but also to aid in stability, body positioning, effective transfer performance and pressure distribution. While an appropriate wheelchair seat cushion provides the user with more function in their wheelchairs, using an unsuitable cushion can be catastrophic. [1,2] Therefore, recommending the right cushion based on user needs is of utmost importance in the field of wheeled mobility. When prescribing a wheelchair cushion, a clinician makes their decision based on certain factors such as the user’s anatomical needs, previous trials and experience. Although there are benefits to having a large variety of cushions to choose from, it can be difficult to translate each of these cushion’s individual properties into clinical necessity. To do so requires objective information regarding the performance of the cushions, which can be transcribed into what would be best practice for the wheelchair user. [3]
ISO 16840-2, Determination of physical and mechanical characteristics of seat cushions intended to manage tissue integrity, is a published standard by the International Organization of Standardization that provides test methods used to characterize cushion performance. The standard has been adopted and improved as RESNA WC-3, Section 2. Although the rationales link the measured quantities to clinical relevance for the end user’s experience, the standard also states that “the link to clinical efficacy, although implied, has not been validated.” [4,5]
Two specific test methods described in WC-3 Section 2, impact damping and hysteresis, are both tests used to characterize cushions’ dynamic behavior. The impact damping test denotes a cushion’s ability to dissipate energy to reduce the impact of loading on the tissues and maintain postural stability. [4] In real case scenarios, loading impacts must be dealt with when a wheelchair goes over obstacles or rolls off a curb. This is an important performance characteristic since tissues are made more susceptible to pressure injury when they are exposed to higher magnitude of loading or multiple impacts. On the other hand, the hysteresis test measures the amount of energy that is lost to the wheelchair cushion during a cycle of compression and unloading. When a wheelchair is going down a flight of steps or traversing rough terrain, a cushion with a larger hysteresis transfers less energy onto the user’s tissues and consequently absorbs more energy. [4]
Standards claim that there is a relationship between impact damping and hysteresis. While the possible link between the two has been explored in the past by Hillman et al., [3] the ISO standard has since been revised. The previously published version of the standard (2007) evaluated impact damping using rebound parameters. Chung and Sprigle promoted analysis of impacts instead of rebounds, since largest tissue compression occurs at impact accelerations, and consequently better represents clinical conditions. [6,7] Further, the ISO 2007 standard did not control for placement of the accelerometer. This introduced variability in test results since the acceleration is a function of distance to the axis of rotation. [7] This issue has been addressed in the revised ISO 2018 standard. Change in recovery time is also an important aspect of the standard that has been revised. In the former standard, the hysteresis test was conducted as step-wise loading at 2-minute intervals. The newer version has eliminated the recovery time and is a continuous compression-unloading cycle.
The objective of this study was to first establish the intralaboratory repeatability of the 2018 standard impact damping and hysteresis tests and indicate their ability to differentiate between cushions. Following this, the aim was to examine if a relationship exists between the two tests as per the rationale provided in the standards.
MATERIALS AND METHODS
A cohort of 21 cushions were selected on the basis of healthcare codes by the Centers for Medicare and Medicaid Services (CMS) and material of construction that collectively provides a good representation of what is commercially available to wheelchair cushion users. Previous literature was analyzed to ensure that the selected cushion cohort contained cushions previously tested as well as untested cushions.

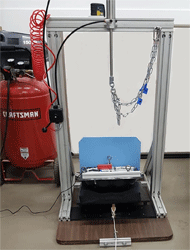
The hysteresis test used an RCLI attached to a loading rig (Alliance RF 100, MTS Corporation). The loading rig with RCLI applied a preload of 8N to the cushion, and then cycled from 8N to 750N and back at a rate of 1 mm/sec. The thickness of the cushion under the basepoints of the RCLI was calculated at different forces during compression and unloading. The test was repeated for a total of three trials per cushion. Hysteresis indices were calculated for 250N by subtracting the quantity of the average unloading thickness at 250N divided by the average compressive thickness a 250N from 1. Hysteresis indices were calculated for 500N using the same calculation but with values obtained at 500N.
The data from the accelerometer was analyzed using a MATLAB script. An intraclass correlation coefficient (ICC) and repeatability coefficient (RC) was processed for all the measured parameters. Two values from the intraclass correlation were obtained, the single rater ICC and the average rater ICC. The ICC and RC assess the repeatability of a test protocol, and its ability to distinguish between cushions. The ICC was computed using a two-way mixed effects model under the Absolute agreement definition. The RC value shows the test-retest reliability and is calculated as the standard deviation between trial measurements multiplied by 1.96 and √2. [8,9]
RESULTS
h250 |
h500 |
I1 |
I2 |
I2:I1 |
|
Single ICC |
0.985 |
0.944 |
0.922 |
0.951 |
0.977 |
Average ICC |
0.995 |
0.981 |
0.973 |
0.983 |
0.922 |
RC |
- |
- |
0.351 g |
0.215 g |
3.920% |
Mean ± SD |
0.153 ± 0.086 |
0.112 ± 0.056 [0.027 - 0.238] |
2.777 g ± 0.432 g [2.067 g - 3.560 g] |
1.125 g ± 0.343 g [0.650 g - 1.858 g] |
38.852 % ± 9.030 % [22.449 % - 57.351 %] |

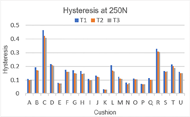
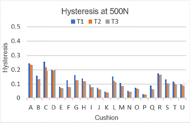
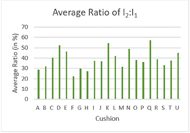
Figures 2-3 show hysteresis indices and impact damping ratios. To quantify the relationship between the impact damping and hysteresis tests, a Pearson’s correlation was applied between the metrics of both tests. The results of the correlation are given in Table 2.
DISCUSSION

The hysteresis values obtained from this study ranged from 0.030 to 0.433 for h250 and 0.027 to 0.238 for h500. These are quite similar to the ranges of 0.041 to 0.307 for h250 and 0.023 to 0.223 for h500 obtained by Hillman et al. [3] Figures 2 a and 2 b depict the cushion hysteresis indices at 250N and 500N for the three trials. Close examination of the graphs shows that in majority of the cases, the first trial shows a larger hysteresis than the subsequent two trials. This could be attributed to two reasons, namely, not giving the cushion enough time to recover post trial, or not appropriately resetting the cushion. The protocol followed allowed each cushion to rest for approximately 5 minutes between trials. Given that the standard calls for a minimum recovery time of 5 minutes, a longer time should have been allotted to each cushion to regain its full thickness. Since certain cushions contain materials that get displaced while testing, proper care should be ensured to reset it according to manufacturer instructions. Bafana had observed a similar trend and concluded that the RC calculated for hysteresis is not reported because it would not be a true representation of the test’s repeatability. However, this does not show a low repeatability, it just indicates that the readings are systematically different and so the RC does not consider them to be true replicates. [10] The RC values computed for the impact damping test show that the repeatability between trials is better for the second impact than the first, however the values are quite small, so the test-retest repeatability and precision of the test are very good. Additional work is needed to assess interlaboratory repeatability as well as repeatability when the cushions are tested again in this laboratory.
Correlations |
Correlation Coefficient (n=21) |
Significance |
|---|---|---|
| I1 with h250 | 0.164 | p=0.479 |
| I1 with h500 | 0.015 | p=0.948 |
| I2 with h250 | 0.001 | p=0.997 |
| I2 with h500 | -0.101 | p=0.662 |
| I2:I1 with h250 | -0.128 | p=0.581 |
| I2:I1 with h500 | -0.242 | p=0.290 |

The data from this study show that the correlations between the two tests’ metrics are quite weak. Although the discrepancy in recovery time has been reduced, the loading time scales between the two tests are still different. The time of recovery in the impact damping test is dependent on the time between consecutive impacts, while the time of recovery in the hysteresis test is dependent on the speed at which the loading and unloading occurs. The study conducted by Hillman et al. used both rebounds and impacts to examine the relationship between the two tests on a set of 37 cushions. [3] Comparing this study with Hillman et al. revealed that the correlations were similar except in the case of the correlation of I1 with h250, where they found a weak negative coefficient. However, the coefficients are also very close to zero, indicating the first impact is independent from hysteresis. It is also interesting to note that they found the correlations between the rebounds and hysteresis were stronger than those for impacts. Additionally, when a subset of cushions was selected to represent a simpler construction, the correlations of the rebound ratio with hysteresis was quite high with statistical significance achieved.
Despite the fact that the test results have not shown a significant association as indicated in the standard’s rationale, it is still important to note that the change in recovery time and consideration of impacts as opposed to rebounds has not changed the weak relationships between the two tests’ metrics. It should also be noted that given the complex nature of some of the cushions, it would be useful to sub categorize the cushions to represent samples that are more similar to each other to reduce the variability that comes with different material constructs. Doing so can provide a clearer picture of the perceived link between impact damping and hysteresis, and once established, can be applied to a more varied sample.
REFERENCES
[1] Ferguson-Pell, M. W. (1990). Technical considerations--Seat cushion selection. Journal of rehabilitation research and development, 49.
[2] Watanabe, L. (2016). Comprehending cushion codes. Retrieved from https://mobilitymgmt.com/articles/2016/08/01/cushion-codes.aspx
[3] Hillman, S. J., Hollington, J., Crossan, N., & Torres-Sánchez, C. (2018). Correlation of ISO 16840-2: 2007 impact damping and hysteresis measures for a sample of wheelchair seating cushions. Assistive Technology, 30(2), 77-83.
[4] RESNA (2018). RESNA American National Standard for Wheelchairs - Volume 3: Wheelchair Seating. Rehabilitation Engineering and Assistive Technology Society of North America. Arlington, VA.
[5] International Organization for Standardization (2018). ISO 16840-2: Wheelchair seating. Geneva, Switzerland.
[6] Chung, B. M. (2009). Dynamic response of wheelchair cushions. In 25th Southern Biomedical Engineering Conference 2009, 15–17 May 2009, Miami, Florida, USA (pp. 47-50). Springer, Berlin, Heidelberg.
[7] Sprigle, S., Chung, B., & Meyer, T. (2010). Assessment of the ISO impact damping test for wheelchair cushions. Assistive Technology®, 22(4), 236-244.
[8] Bland, J. M., & Altman, D. G. (1999). Measuring agreement in method comparison studies. Statistical methods in medical research, 8(2), 135-160.
[9] Koo, T. K., & Li, M. Y. (2016). A guideline of selecting and reporting intraclass correlation coefficients for reliability research. Journal of chiropractic medicine, 15(2), 155-163.
[10] Bafana, R. P. (2005). Development, evaluation and implementation of wheelchair seat cushion testing standards (Master’s Thesis, University of Pittsburgh).
[11] Hollington, J., Hillman, S. J., Torres-Sánchez, C., Boeckx, J., & Crossan, N. (2014). ISO 16840-2: 2007 load deflection and hysteresis measurements for a sample of wheelchair seating cushions. Medical engineering & physics, 36(4), 509-515.
ACKNOWLEDGEMENT
The contents were developed under a grant from the National Institute on Disability, Independent Living, and Rehabilitation Research (NIDILRR grant number 90REGE0001). NIDILRR is a Center within the Administration for Community Living (ACL), Department of Health and Human Services (HHS). The contents do not necessarily represent the policy of NIDILRR, ACL, or HHS, and you should not assume endorsement by the Federal Government.