Adrien Pajon![]() 1,2
1,2![]() , Jean Leblond
, Jean Leblond![]() 2
2![]() , François Routhier
, François Routhier![]() 1,2
1,2![]()
![]() 1
1![]() Department of Rehabilitation, Université Laval (Québec, Canada),
Department of Rehabilitation, Université Laval (Québec, Canada), ![]() 2
2![]() Centre for interdisciplinary research in rehabilitation and social integration, Centre intégré universitaire de santé et de services sociaux de la Capitale-Nationale (Québec, Canada)
Centre for interdisciplinary research in rehabilitation and social integration, Centre intégré universitaire de santé et de services sociaux de la Capitale-Nationale (Québec, Canada)
BACKGROUND
An estimated 43,000 individuals are power wheelchair (PWC) users in Canada, representing ~15% of all wheeled mobility device use (manual wheelchairs, power wheelchairs and scooters) [1]. A similar proportion of PWC users is estimated in the USA. From a sample of approximately 3.7M users of wheeled mobility devices in the USA, we can estimate the number of PWC users to be around 300,000. Evidence supports that PWC can positively impact the well-being, self-esteem, pain, activity, and participation of those individuals (e.g. [2–4]). Several studies report various problems caused by vibrations experienced during wheelchair use (e.g., low-back and neck pain, muscle aches and fatigue [5, 6]). However, these studies mainly focus on long-term PWC use and do not map the vibration response according to obstacle type, setting preferences or PWC components. Thus, it is difficult to determine the cause and impacts of vibrations, which may inform PWC set-up, positioning and training for an optimal use.
Indeed, during the design or prescription of PWC, different settings and components can be chosen like wheel types, active wheel position, setup of shock absorbing systems, etc. When facing ground perturbations (GP),depending on their capacities and wheelchair characteristics, PWC users can react differently both to perturbations and their reactive vibrations. This can be more or less comfortable. They can slide on the seat or even lose control of their PWC which can generate fatigue or, in the worst cases, injuries. PWC manufacturers provide documentation on their products and some are known to have stiff or smooth shock absorbers. However, to our knowledge, there is currently no study to quantify the effects of GP on PWC users' efforts to remain in control of their device. In a previous study [7], we proposed a method to quantify and analyze the vibrations on PWC users when overcoming an obstacle.
Being able to quantify the vibrations on PWC users in any situation will help to compare designs and settings of PWC to: (i) find the best choices with respect to the PWC users' environments and potential GP; and (ii) give comparative metrics for design improvements. Indeed, as supported by several studies [8–10], PWC design can be improved by considering the potential vibrations experienced by the users.
OBJECTIVES
The study's objectives were to: 1) measure vibrations generated by different PWC designs, and 2) compare these measures to map the vibration quantities that are dependent on different experimental variables (speed, obstacle, and PWC model).
METHODS
The experimental method used to measure the quantity of vibration is based on the method proposed in a previous study [7], but includes a few improvements on the measurement apparatus to respect the requirement from the International Standards Organization 2631-1 standard on human vibration [11] (ISO 2631-1) and the statistical method to take into account repeated measures from sensors.
Measurement apparatus
As a requirement from the ISO 2631-1 [11], the minimum frequency bandwidth to measure vibrations that affect the health and comfort in humans is 1-80Hz. To track motion and vibration, we chose to replace the inertial motion units (IMU) from Xsens (limited sampling rate of 100Hz, bandwidth of 0-50Hz) with those from Endaq (S3-16 Vibration Sensor) (sampling rates up to 3200Hz, bandwidth of 0-300Hz). Additionally, since different PWC models have different frames, the positioning of sensors does not allow standardized comparisons. We chose to measure vibration on the torso and thighs of the dummy, not modifying the sensors' location.
The vibrations are 3D recorded, the x-axis represents the driving forward direction, the y-axis, the lateral direction of the PWC and z-axis, the vertical direction normal to the seat base.
As presented in a previous study [7], the CoP didn't move much while using the headless dummy, which wasn't representative of reality. Thus, we choose not to use the pressure mattress sensors (only keep it for experiments with human subjects).
Signal analysis
IMUs measure accelerations that are used to quantify vibrations. Based on the ISO 2631-1 standard [11], the vibration dose value (VDV, Eq. 1) and signal energy (Es, Eq. 2) methods applied on measured acceleration should be used to assess the effects of vibration on health and comfort. The VDV primarily characterizes the amplitude of vibration while Es characterizes the oscillation. Higher scores indicate higher vibrations. The signal analysis was performed using the programming language Julia 1.6.0.
Statistical analysis
The statistical method used to analyze the data and determine the impact of PWC settings was nparLD [12]. PWC speeds, obstacle types and PWC models were defined as independent variables. The different IMUs were defined as repeated variables. Es and VDV were the dependent variables. The statistical analysis was done with the package nparLD (version 2.1, 2012-09-19 September 19 2021) using R (version 4.0.2). The nparLD analysis can only analyze two independent variables at a time but we have three of them. We choose to keep: (i) the PWC models the same since our objective was to compare them; and (ii) PWC speeds since we wanted to measure the vibrations according to the type of obstacle. The level of significance is set at 0.05.
Procedure
We used PWC from three different manufacturers, with different mechanical structures and wheel positions: Amylior (Alltrack R3 Hybrid), Permobil (M300), and Quantum (Edge3 Stretto). They were set up as follows: (i) the left armrest was removed to position the dummy; (ii) the original backrest- cushion was removed, and the dummy was placed on the rigid and flat part of the backrest, and (iii) the seat cushion was removed and replaced by two superimposed foam cushions. To control and drive the PWC during the experiment, the right armrest remained on the PWC and the control joystick was activated by an operator who walked alongside the PWC. During the experiments, we used three pre-programmed control speed: Low = 0.6m/s, Medium = 1.2m/s and High = 1.8m/s. Those values were based on measurements from the encoder.
We chose to test door threshold (DT) as a GP simulated using planks (101mm x 1520mm) of different heights (11mm, 16mm and 27mm). Those planks were attached to the floor with brackets on one side and with double-sided tape on the other side, strong enough to avoid movement when the PWC drove over the obstacles. To assess changes in experimental variables, each setup was used at least seven times to ensure statistical strength of the analyses. Each trial was repeated 10 times (9 setups x 10 trials = 90 trials).
RESULTS and DISCUSSION
Table 1 presents the p-value of the impact of the variables and their interactions on the Es. Note that only the results of Es were analyzed, since the results in terms of VDV are very similar. In all conditions, the combinations of experimental conditions (speed and position of the sensor) had a significative impact on vibrations (p < 0.05). As demonstrated in the previous study [7], the higher the speed and obstacle height, the higher the amplitude of vibrations. Along the x and z-axis, the PWC model had a significant impact on vibrations. This means that at least one PWC model generates more or less vibration on the dummy than the others. This is not the case along the y-axis. This is probably due to the way the PWC approaches the DT. Indeed, the PWC is driven towards the DT, and if the PWC structure is well balanced, the lateral vibration should be almost the same and be smaller than for the other axes (up to 20 times smaller for the highest speed and higher obstacle).
| p-value | ||||||||||
| DT of 11mm | DT of 16mm | DT of 27mm | ||||||||
Variable interactions |
x-axis | y-axis | z-axis | x-axis | y-axis | z-axis | x-axis | y-axis | z-axis | |
Speed |
>0.00001 | 0.010 | >0.00001 | >0.00001 | 0.0006 | >0.00001 | >0.00001 | >0.00001 | >0.00001 | |
PWC model |
>0.00001 | 0,.91 | >0.00001 | >0.00001 | 0.001 | >0.00001 | >0.00001 | 0.001 | >0.00001 | |
Sensor |
>0.00001 | >0.00001 | >0.00001 | >0.00001 | >0.00001 | >0.00001 | >0.00001 | >0.00001 | >0.00001 | |
Speed: PWC model |
>0.00001 | 0.031 | >0.00001 | >0.00001 | 0.154 | >0.00001 | >0.00001 | 0.455 | >0.00001 | |
Speed: Sensor |
>0.00001 | >0.00001 | >0.00001 | >0.00001 | >0.00001 | >0.00001 | >0.00001 | >0.00001 | >0.00001 | |
PWC model: Sensor |
>0.00001 | 0.003 | >0.00001 | >0.00001 | >0.00001 | >0.00001 | >0.00001 | 0.082 | >0.00001 | |
Speed: PWC model: Sensor |
>0.00001 | 0.307 | >0.00001 | >0.00001 | 0.034 | >0.00001 | >0.00001 | 0.002 | >0.00001 | |
Table 2 presents the p-value for the post-hoc impact analysis of the PWC model on the Es. In the x and z axes, the vibrations are significantly different between all PWC models (p < 0.05) for the DTs of 11mm and 27mm. For the DT of 16mm, along the x-axis, the vibrations for the Amylior and Quantum PWCs are equivalent (p-value > 0.05). On the z-axis, the vibrations for the Permobil and Quantum PWSs are equivalent (p-value > 0.05). Hence, any difference of the effect size RTE (relative treatment effect) illustrates a significant difference in vibrations. This is not the case on the y-axis, but, as previously explained, vibrations in this axis are much smaller.
|
|
p-value |
||||||
| DT of 11mm | DT of 16mm | DT of 27mm | ||||||
PWC model |
Amylior | Permobil | Amylior | Permobil | Amylior | Permobil | ||
x-axis |
Permobil |
>0.00001 | >0.00001 | >0.00001 | ||||
Quantum |
>0.00001 | >0.00001 | 0.362 | >0.00001 | >0.00001 | 0.007 | ||
y-axis |
Permobil |
0.245 | 0.0008 | 0.000 | ||||
Quantum |
0.086 | 0.471 | 0.690 | 0.006 | 0.006 | 0.565 | ||
z-axis |
Permobil |
>0.00001 | >0.00001 | >0.00001 | ||||
Quantum |
>0.00001 | .0.0006 | >0.00001 | 0.547 | >0.00001 | >0.00001 | ||
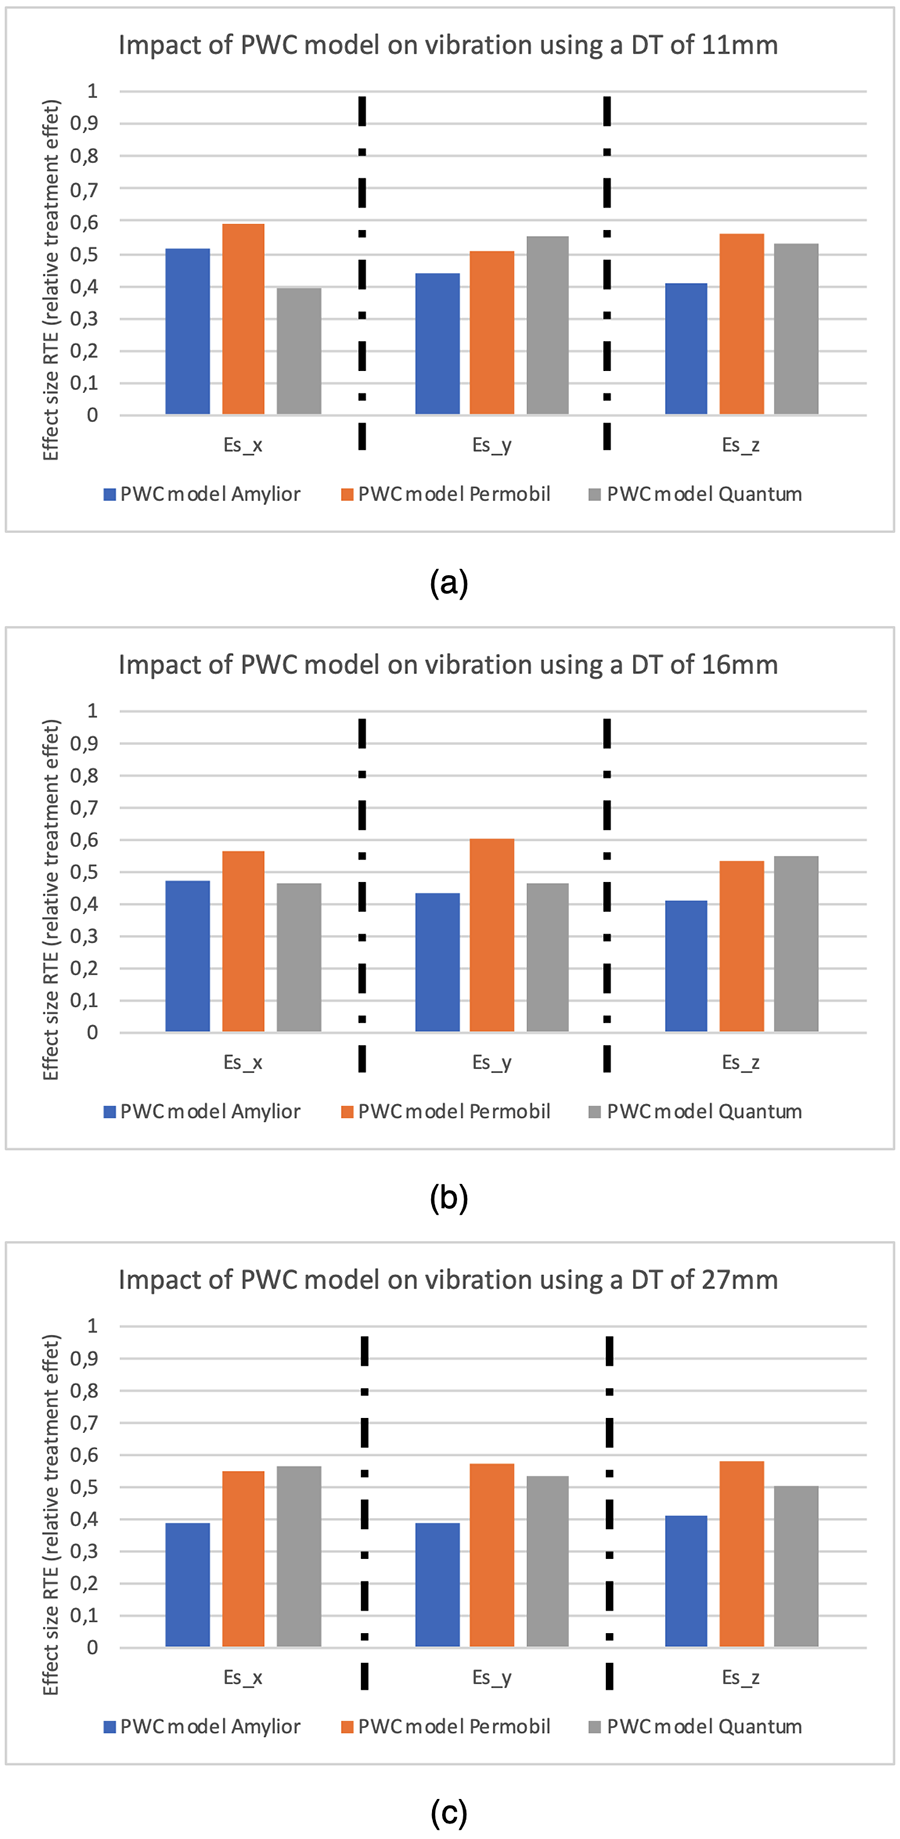
Fig. 1 shows the effect size RTE [13] of the PWC model for each DT height along all axes on Es. This represents the vibration intensity with respect to the average, a higher score representing higher vibration. Each three-bar set represents the effect size RTE for each PWC model (separate statistical analysis). As vibrations without treatment don't exist (you cannot remove the experimental settings to obtain values for vibration), we consider the mean value of all vibrations as the no treatment value with an effect size value H0 of 0.5. In most cases, the effect size RTE of the Amylior PWC is the lowest or equivalent to the other PWC models. The DT of 11mm is the only experimental condition where the effect size RTE of the Amylior PWC on the x-axis is in second place in terms of vibration intensity. On the other hand, the Permobil PWC generates, in most cases, the highest effect size RTE.
This experiment allowed the comparison of vibration quantity generated by three different PWC models on users when wheeling on three different DT. In general, the Amylior PWC seems to generate less vibrations, while the Permobil PWC seems to generate the most. In future experiments, the number of disturbance types will be increased and other PWC models will be used to map the vibrations generated on PWC users. This will provide clinicians with information for the selection of the PWC model that fits best with the user's environments, according to the most likely and complex disturbances the user has to overcome.
CONCLUSION
In this study, we presented experimental measures of vibrations generated on PWC users. The experiment with the door threshold obstacle (DT) allowed to compare three PWC models from different manufacturers (Amylior, Permobil and Quantum). The results suggest that the Amylior PWC generated less vibrations. Although statistical differences were observed, clinical significance must now be determined. Mechanical design and PWC structure must also be assessed to understand what causes these differences.
REFERENCES
[1] Smith EM, Giesbrecht EM, Mortenson WB, et al. Prevalence of Wheelchair and Scooter Use Among Community-Dwelling Canadians. Phys Ther 2016; 96: 1135–1142.
[2] Salminen A-L, Brandt Å, Samuelsson K, et al. Mobility devices to promote activity and participation: a systematic review. J Rehabil Med 2009; 41: 697–706.
[3] Rousseau-Harrison K, Rochette A, Routhier F, et al. Impact of wheelchair acquisition on social participation. Disabil Rehabil Assist Technol 2009; 4: 344–352.
[4] Frank A, Neophytou C, Frank J, et al. Electric-powered indoor/outdoor wheelchairs (EPIOCs): users' views of influence on family, friends and carers. Disabil Rehabil Assist Technol 2010; 5: 327–338.
[5] Wolf E, Cooper RA, Pearlman J, et al. Longitudinal assessment of vibrations during manual and power wheelchair driving over select sidewalk surfaces. J Rehabil Res Dev 2007; 44: 573–580.
[6] Garcia-Mendez Y, Pearlman JL, Boninger ML, et al. Health risks of vibration exposure to wheelchair users in the community. J Spinal Cord Med 2013; 36: 365–375.
[7] Pajon A, Bazinet M-L, Leblond J, et al. Preliminary experimental method to quantify vibrations with various powered wheelchair set-ups. Virtual, https://www.resna.org/sites/default/files/conference/2021/SeatingandMobility/102_PAJON.html (2021).
[8] Cooper RA, Boninger ML, Spaeth DM, et al. Engineering Better Wheelchairs to Enhance Community Participation. IEEE Trans Neural Syst Rehabil Eng 2006; 14: 438–455.
[9] Sprigle S, Cohen L, Davis K. Establishing seating and wheeled mobility research priorities. Disabil Rehabil Assist Technol 2007; 2: 169–172.
[10] Dicianno BE, Joseph J, Eckstein S, et al. The future of the provision process for mobility assistive technology: a survey of providers. Disabil Rehabil Assist Technol 2019; 14: 338–345.
[11] ISO/AWI 2631-1 — Mechanical vibration and shock — Evaluation of human exposure to whole-body vibration — Part 1: General requirements, https://www.iso.org/cms/render/live/en/sites/isoorg/contents/data/standard/07/63/76369.html.
[12] Noguchi K, Gel YR, Brunner E, et al. nparLD: An R Software Package for the Nonparametric Analysis of Longitudinal Data in Factorial Experiments. J Stat Softw 2012; 50: 1–23.
[13] Vargha A, Delaney HD. A Critique and Improvement of the CL Common Language Effect Size Statistics of McGraw and Wong. 32.
Acknowledgements
This study was funded by MITACS Accélération (Partnership with Amylior Inc., Vaudreuil, Canada)