Data-driven modeling to predict prehabilitation adherence in frail individuals with ESKD
Mikayla E Deehring1, H Philo Katzman1, Atiya Dhala2, Momona Yamagami1
1Rice University, 2Houston Methodist Research Institute
INTRODUCTION
Chronic kidney disease affects an estimated 1 in 7 adults in the United States [1]. At the endpoint of disease progression, end-stage kidney disease (ESKD), people living with kidney disease are on dialysis and require a kidney transplant to survive [2]. Although the cause is not well understood, individuals living with ESKD experience higher rates of frailty than their healthy counterparts [3,4]. Frailty, most commonly described by the Fried Frailty Phenotype [5], is associated with many adverse health outcomes, including an increased risk of death following kidney transplantation [3,6]. Because of the increased risk of poor outcomes, frailty is often part of the risk assessment for kidney transplant qualification and is associated with a lower likelihood of placement on the kidney transplant waiting list [3,6]
Prehabilitation (physical therapy performed prior to transplantation) has been shown to reduce frailty in individuals living with ESKD [3]; however, current protocols require frequent in-person visits with a physical therapist. This can be burdensome for individuals with ESKD because the prehabilitation can last years while they wait for a kidney to be available [7], and many individuals may struggle to afford long-term physical therapy or face difficulty with obtaining insurance coverage for the physical therapy [8]. Accessible at-home alternatives are preferable, but the prehabilitation must be performed at the appropriate exertion for the prescribed length of time to be efficacious. In this work, we investigate whether data collected through a smartwatch worn on the dominant wrist is sufficient to automatically predict exercise type and exertion during prehabilitation exercises and answer the following questions:
- Which machine learning models perform best at predicting exertion and exercise type?
- Do subject-specific models outperform global models?
- Does the presence of sensitive attributes, such as age, weight, and height, improve predictions?
METHODS
Experimental design
We recruited six participants between the ages of 55 and 80 (mean age: 67, 3 women). Participants exercised for less than 150 minutes weekly and had no self-disclosed disabilities or chronic conditions. Participants were fitted with an Empatica EmbracePlus [9] smartwatch on their dominant wrist. Data was recorded at rest while the participants completed surveys, during baseline testing (Fried Frailty Phenotype [5], 6-minute walk test, timed up-and-go), and during the prehabilitation protocol. The prehabilitation protocol was developed by Houston Methodist Hospital for patients being evaluated for kidney transplantation. It consists of resistance band exercises (squats, rows, chest press, hip abduction, seated knee extension, and glute bridges) performed in 3 sets of 10, followed by 20 minutes of aerobic exercise on a treadmill. For all exercises, the participants were asked to try to maintain a rating of perceived exertion (RPE) of 3-4 on the Modified Borg Scale [10], except for an additional set of squats and the last 5 minutes on the treadmill, where they were asked to try to maintain an RPE of about 7. Participants self-selected resistance band strength as well as treadmill speed and incline. During the prehabilitation portion of the experiment, participants were asked their RPE between sets of resistance band exercises or approximately once per minute during the aerobic exercise. After prehabilitation, participants rested with the watch on until their reported RPE was 1 or lower for at least one minute.
Machine learning and analysis
Preprocessing
Data from the EmbacePlus was interpolated, averaged, or a value was calculated to create tabular data representing 5-second windows with no overlap for each participant. The features included were pulse rate, number of blood volume pulses, electrodermal activity, steps, body temperature, triaxial actigraphy counts, the vector magnitude of the actigraphy counts, the standard deviation of the blood volume pulse and accelerometer data, and the spectral power of the accelerometer data. Features were selected based on data available from the Empatica EmbracePlus.
We predicted exercise type (at rest before performing any exercises, performing baseline testing, taking a break between exercises or immediately following exercise, resistance exercise, aerobic exercise) and participant reported RPE. As we only asked for their RPE each minute, the RPE was interpolated to the nearest value in each direction. The tabular data was split into train, validation, and test sets in an 80/10/10 split. The train set was oversampled to balance classes using SMOTE [11], a technique that creates synthetic data for minority classes in a dataset, and data was scaled using the minimum and maximum values in the train set.
Subject-specific models
Five models were trained for five of the six participants and both prediction tasks (RPE and exercise type): random forest (RF), logistic regression (LR), multi-layer perceptron model (MLP), Adaboost, and naïve Bayes classifier (NBC). The train set was used with three-fold cross-validation to tune hyperparameters for each model. The best model for each participant was selected by performance on the validation set, which was measured using balanced accuracy adjusted for chance. The best-performing model was then assessed using the test set, and performance was again measured using balanced accuracy adjusted for chance.
After the best model was determined, the mean accuracy decrease for each feature was calculated with n=50 repeats.
Global models
The same steps were repeated for the global models and performed twice, first with the same features (global) and then with age, height, and weight (global with sensitive attributes) because prior work suggests that physiological features can improve RPE prediction performance [12] . Data was again split into train/validation/test along an 80/10/10 split. We chose this split rather than a leave-one-out split for better comparison to the subject-specific models. All 6 participants’ data was used for the global models.
Table 1. Test performance of random forest models
|
Prediction Task |
Chance-Adjusted Balanced Accuracy |
||
|
Subject-Specific (mean±std) |
Global |
Global with Sensitive Attributes |
|
|
RPE |
89.8±5.1% |
91.2% |
92.6% |
|
Exercise Type |
93.7±5.4% |
96.8% |
97.5% |

RESULTS
Random forest performs best for predicting RPE and exercise type
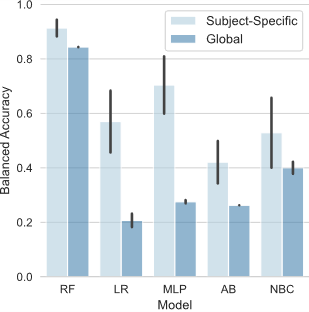
Random forest models performed best for predicting both RPE and exercise type across all model types with an average validation accuracy of 91.3%, 84.3%, and 84.3% for the RPE task, respectively (Figure 1) and 95.7%, 94.1%, and 94.9%, respectively, for the exercise type task (not shown).


Subject-specific models perform similarly to global models, and sensitive attributes did not significantly impact accuracy
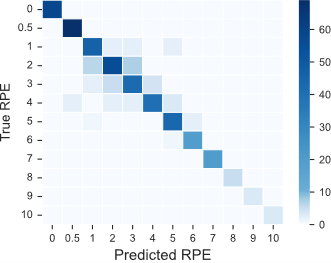
All random forest models performed similarly across prediction tasks, model types, and the presence of extra sensitive attributes, with an average prediction accuracy of 93.6% across model types and prediction tasks (Table 1). Incorrect predictions are usually close to the true predictions (Figure 3).

Feature importance varied between individuals
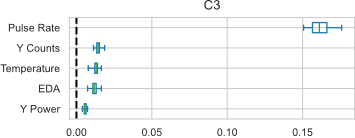
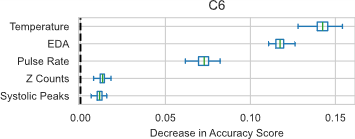
Although pulse rate, electrodermal activity (EDA), and skin temperature were the most important features for four of the participants and the global models (with and without sensitive attributes), the relative ordering and overall mean accuracy decrease varied greatly (sample participants shown in Figure 2).
DISCUSSION
Our preliminary work suggests that random forest models can predict exercise type and RPE with over 90% balanced accuracy. Even in cases where the RPE prediction was incorrect, the random forest models still typically predicted a value close to the actual value (Figure 3). Because of the interpolation method for RPE (both directions to the nearest RPE value recorded), it is possible that a different interpolation scheme (i.e., one that accounts for transitions between reported RPE) or using linear regression with linear interpolation would have resulted in an even higher performance.
These results also show that over 90% accuracy can be achieved with a global model, even without the participants’ sensitive attributes; however, this analysis used a train/validation/test split rather than a leave-one-out method to make the global models more comparable to the subject-specific models. Individuals whose data is not included in the global dataset would likely have lower accuracy, and the additional features would likely be more useful for prediction in these cases.
CONCLUSION
This study demonstrates that RPE and exercise type can be predicted from smartwatch data with over 90% accuracy using both subject-specific and global random forest models. Our work lays the foundation for a platform to remotely monitor adherence to prehabilitation and offer real-time guidance to improve adherence during sessions. Future work with a larger sample size, including end-stage kidney disease patients, is needed to confirm the results before developing a monitoring platform.
REFERENCES
[1] Chronic Kidney Disease in the United States, 2023. (n.d.-a). Retrieved 15 April 2024, from https://www.cdc.gov/kidneydisease/publications-resources/ckd-national-facts.html
[2] End-stage renal disease. (2024b). Mayo Clinic. https://www.mayoclinic.org/diseases-conditions/end-stage-renal-disease/symptoms-causes/syc-20354532
[3] Lorenz, E. C., Kennedy, C. C., Rule, A. D., LeBrasseur, N. K., Kirkland, J. L., & Hickson, L. T. J. (2021c). Frailty in CKD and Transplantation. Kidney International Reports, 6(9), 2270–2280. https://doi.org/10.1016/J.EKIR.2021.05.025
[4] Alfieri, C., Malvica, S., Cesari, M., Vettoretti, S., Benedetti, M., Cicero, E., Miglio, R., Caldiroli, L., Perna, A., Cervesato, A., & Castellano, G. (2022d). Frailty in kidney transplantation: a review on its evaluation, variation and long-term impact. Clinical Kidney Journal, 15(11), 2020. https://doi.org/10.1093/CKJ/SFAC149
[5] Robert Allison, I., Assadzandi, S., & Adelman, M. (2021e). Frailty: Evaluation and Management. American Family Physician, 103(4), 219–226. https://www.aafp.org/pubs/afp/issues/2021/0215/p219.html
[6] McAdams-Demarco, M. A., Thind, A. K., Nixon, A. C., & Woywodt, A. (2023f). Frailty assessment as part of transplant listing: yes, no or maybe? Clinical Kidney Journal, 16(5), 809–816. https://doi.org/10.1093/CKJ/SFAC277
[7] Davis, A. E., Mehrotra, S., McElroy, L. M., Friedewald, J. J., Skaro, A. I., Lapin, B., Kang, R., Holl, J. L., Abecassis, M. M., & Ladner, D. P. (2014g). The extent and predictors of waiting time geographic disparity in kidney transplantation in the United States. Transplantation, 97(10), 1049–1057. https://doi.org/10.1097/01.TP.0000438623.89310.DC
[8] Yamagami, M., Mack, K., Mankoff, J., Steele, K. M., Mack, ; K, & Mankoff, J. (2022h). “I’m Just Overwhelmed”: Investigating Physical TherapyAccessibility and Technology Interventions for Peoplewith Disabilities and/or Chronic Conditions. ACM Transactions on Accessible Computing, 15(4). https://doi.org/10.1145/3563396
[9] EmbracePlus . (2020i). Empatica. https://www.empatica.com/embraceplus/
[10] Williams, N. (2017j). The Borg Rating of Perceived Exertion (RPE) scale. Occupational Medicine, 67(5), 404–405. https://doi.org/10.1093/occmed/kqx063
[11] Chawla, N. V., Bowyer, K. W., Hall, L. O., & Kegelmeyer, W. P. (2011k). SMOTE: Synthetic Minority Over-sampling Technique. Journal Of Artificial Intelligence Research, 16, 321–357. https://doi.org/10.1613/jair.953
[12] Albert, J. A., Herdick, A., Brahms, C. M., Granacher, U., & Arnrich, B. (2021l). Using Machine Learning to Predict Perceived Exertion during Resistance Training with Wearable Heart Rate and Movement Sensors. Proceedings - 2021 IEEE International Conference on Bioinformatics and Biomedicine, BIBM 2021, 801–808. https://doi.org/10.1109/BIBM52615.2021.9669577