Impact of walker height on gait biomechanics: A pilot study
A. Orr1, R. Chandrashekhar1,2, H. Wang1,2
University of Florida1
Technology for Occupational Performance Lab, Department of Occupational Therapy2
INTRODUCTION
The geriatric population is projected to increase to 1.2 billion in 2025 compared to 600 million in 2000[1]. Among such a population, proper stability during walking can be impaired due to physiological changes that occur during aging, chronic illness, or more [1]. Maintaining stability during everyday movement is vital to functioning independently and properly [2]. In the elderly population, proper stability being affected during walking can lead to injuries and falls that in 2019 resulted in three million emergency department visits [3]. The use of mobility devices, such as walkers, is a common treatment method for elderly individuals with balance deficits [2]. However, these devices can lead to a higher risk of falls if not used appropriately [2]. One study even showed that users of assistive devices reported more falls compared to non-users over a three-month period [4]. While walkers are useful assistive devices, there is a lack of consensus on their usefulness due to the reported adverse events associated with their usage, lack of proper maintenance, and guidelines for selection and adjustments [5]. This knowledge gap can delay the usage of walkers for those in need, leading to increased falls and hospitalization with improper usage [6]. Despite this, clear standards or clinical guidelines for walker selection and setup are still lacking.
Biomechanics significantly affects the relationship between mobility assistive devices and their users. In particular, the kinematics at the different phases of the gait cycle affect the nature and severity of these falls. Although many studies exist using a motion capture system to evaluate biomechanics, few look at how walker height settings impact walking biomechanics. This study aims to evaluate the biomechanics of users utilizing walkers at different height settings, including the lowest, highest, and current clinically recommended wrist height.
METHODS
We conducted an exploratory pilot feasibility study with five undergraduate student volunteers who worked on the project. A four-wheeled walker was used for all the experimental tests. Participants were instructed to walk with the walker in three different walker height settings: lowest, highest, and the participants’ wrist height, which is the current clinical recommendation. Participants were asked to wear flat-heeled shoes to not affect the gait cycle analysis. The participants then simulated walking with the rollator by bearing weight on it and walking at a self-selected pace across the length of the lab space (~= 3 meters). All participants completed five walking trials at each walker height setting. All values (excluding gait asymmetry and coefficient of variation) are presented as “Mean ± Standard Deviation” where it is the mean over the five walking trials. The gait asymmetry index (GAI) was calculated using right step length (RSL) and left step length (LSL) using the formula below:
Additionally, stride length variability or coefficient of variation (CV) was calculated using the following formula [7]:
𝐶𝑉 (%) = (𝑠𝑡𝑎𝑛𝑑𝑎𝑟𝑑 𝑑𝑒𝑣𝑖𝑎𝑡𝑖𝑜𝑛/𝑚𝑒𝑎𝑛) ∗ 100
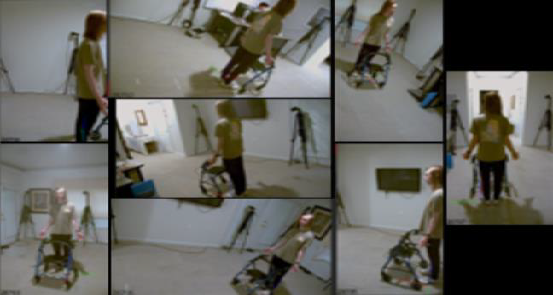
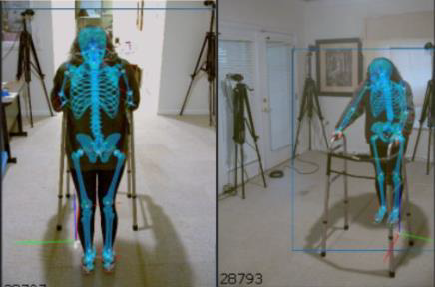
The data was collected using a markerless motion capture system. Qualisys Track Manager (QTM)[8] was used to capture the video, and the biomechanical models were generated using Theia 3D, as seen in Figures 1 and 2, respectively. Theia 3D uses AI and a database of biomechanical models to generate and superimpose a skeleton onto the participant’s body using static and dynamic trials.
Visual 3D[9] was then used to generate the final report consisting of the gait variables (spatiotemporal and kinematic). This study focuses on spatiotemporal data. Data analysis included descriptive statistics and comparing the gait variables at different heights of the walker.
|
|
RESULTS
The five participants were on average, 21 ± 0.89 years old, 1.70 ± 0.07 m tall, and weighed 63.81 ±
10.41 kg. Table 1 presents the stride length, stride width, and step length values; Table 2 presents the stance time, swing time, and double limb support time; and Table 3 presents the GAI values. It is noted that for Participant 5, the highest walker setting and wrist height setting were the same; thus, the values of the gait variables were constant.
Table 1: Spatial variables for participants at three walker heights (highest, wrist, and lowest).
|
Participant |
Stride Length (m) |
|||||
|
Highest |
Wrist |
Lowest |
||||
|
1 |
0.41 ± 0.21 |
0.44 ± 0.20 |
0.48 ± 0.18 |
|||
|
2 |
0.79 ± 0.28 |
0.81 ± 0.23 |
0.91 ± 0.08 |
|||
|
3 |
0.25 ± 0.22 |
0.24 ± 0.21 |
0.24 ± 0.21 |
|||
|
4 |
0.36 ± 0.18 |
0.40 ± 0.17 |
0.32 ± 0.18 |
|||
|
5 |
0.19 ± 0.18 # |
0.19 ± 0.18 # |
0.19 ± 0.18 |
|||
|
Participant |
Stride Length CV (%) |
|||||
|
Highest |
Wrist |
Lowest |
||||
|
1 |
51.22 |
45.45 |
37.50 |
|||
|
2 |
35.44 |
28.40 |
8.79 |
|||
|
3 |
88.00 |
87.50 |
87.50 |
|||
|
4 |
50.00 |
42.50 |
56.25 |
|||
|
5 |
94.74# |
94.74# |
94.74 |
|||
|
Participant |
Stride Width (m) |
|||||
|
Highest |
Wrist |
Lowest |
||||
|
1 |
0.10 ± 0.01 |
0.10 ± 0.01 |
0.11 ± 0.01 |
|||
|
2 |
0.14 ± 0.01 |
0.15 ± 0.01 |
0.14 ± 0.02 |
|||
|
3 |
0.13 ± 0.01 |
0.13 ± 0.01 |
0.12 ± 0.01 |
|||
|
4 |
0.15 ± 0.01 |
0.15 ± 0.01 |
0.14 ± 0.02 |
|||
|
5 |
0.12 ± 0.02 # |
0.12 ± 0.02 # |
0.10 ± 0.01 |
|||
|
Participant |
Step Length (m) |
|||||
|
Highest |
Wrist |
Lowest |
||||
|
Left |
Right |
Left |
Right |
Left |
Right |
|
|
1 |
0.07 ± 0.05 |
0.37 ± 0.18 |
0.06 ± 0.04 |
0.40 ±0.20 |
0.07 ± 0.042 |
0.46 ± 0.1 |
|
2 |
0.39 ± 0.09 |
0.49 ± 0.07 |
0.34 ± 0.05 |
0.53 ± 0.04 |
0.39 ± 0.07 |
0.52 ± 0.04 |
|
3 |
-0.01 ± 0.02 |
0.24 ± 0.22 |
0.01 ± 0.02 |
0.23 ± 0.21 |
0.00 ± 0.02 |
0. 20 ± 0.22 |
|
4 |
0.24 ± 0.19 |
0.16 ± 0.17 |
0.30 ± 0.19 |
0.13 ± 0.15 |
0.17 ± 0.17 |
0.17 ± 0.17 |
|
5 |
0.18 ± 0.18 # |
0.05 ± 0.02 # |
0.18 ± 0.18 # |
0.05 ± 0.02 # |
0.14 ± 0.17 |
0.07 ± 0.11 |
# This indicates that the values are the same as the height of the highest setting was at the wrist height for participant 5.
Table 2: Temporal variables for participants at three walker heights (highest, wrist, and lowest).
|
Participant |
Stance Time (s) |
|||||
|
Highest |
Wrist |
Lowest |
||||
|
Left |
Right |
Left |
Right |
Left |
Right |
|
|
1 |
1.18 ± 0.53 |
0.82 ± 0.45 |
1.16 ± 0.48 |
0.89 ± 0.15 |
1.31 ± 0.35 |
1.06 ± 0.49 |
|
2 |
0.91 ± 0.29 |
0.96 ± 0.29 |
1.01 ± 0.11 |
0.87 ± 0.34 |
1.04 ± 0.14 |
1.04 ± 0.14 |
|
3 |
0.73 ± 0.43 |
0.65 ± 0.25 |
0.72 ± 0.37 |
0.59 ± 0.25 |
0.75 ± 0.39 |
0.63 ± 0.25 |
|
4 |
1.30 ± 0.58 |
1.01 ± 0.55 |
1.27 ± 0.51 |
1.18 +/0 0.59 |
0.93 ± 0.56 |
0.93 ± 0.56 |
|
5 |
0.66 ± 0.33 # |
0.53 ± 0.28 # |
0.66 ± 0.33 # |
0.53 ± 0.28 # |
0.54 ± 0.32 |
0.54 ± 0.32 |
|
Participant |
Swing Time (s) |
|||||
|
Highest |
Wrist |
Lowest |
||||
|
Left |
Right |
Left |
Right |
Left |
Right |
|
|
1 |
0.41 ± 0.11 |
0.48 ± 0.20 |
0.40 ± 0.09 |
0.45 ± 0.15 |
0.47 ± 0.12 |
0.51 ± 0.24 |
|
2 |
0.44 ± 0.13 |
0.41 ± 0.09 |
0.50 ± 0.04 |
0.45 ± 0.08 |
0.49 ± 0.06 |
0.49 ± 0.06 |
|
3 |
0.44 ± 0.18 |
0.45 ± 0.12 |
0.38 ± 0.11 |
0.42 ± 0.11 |
0.40 ± 0.16 |
0.37 ± 0.10 |
|
4 |
0.45 ± 0.18 |
0.43 ± 0.15 |
0.50 ± 0.18 |
0.49 ± 0.20 |
0.47 + 0.17 |
0.43 ± 0.21 |
|
5 |
0.45 ± 0.27 # |
0.42 ± 0.20 # |
0.45 ± 0.27 # |
0.42 ± 0.20 # |
0.40 ± 0.15 |
0.42 ± 0.20 |
|
Participant |
Double Limb Support Time (s) |
|||||
|
Highest |
Wrist |
Lowest |
||||
|
1 |
0.82 ± 0.37 |
0.85 ± 0.25 |
0.93 ± 0.37 |
|||
|
2 |
0.60 ± 0.12 |
0.56 ± 0.11 |
0.57 ± 0.12 |
|||
|
3 |
0.53 ± 0.23 |
0.51 ± 0.18 |
0.53 ± 0.20 |
|||
|
4 |
1.10 ± 0.40 |
1.13 ± 0.31 |
0.99 ± 0.35 |
|||
|
5 |
0.52 ± 0.23 # |
0.52 ± 0.23 # |
0.57 ± 0.20 |
|||
Table 3: Gait Asymmetry Index (GAI) values at three walker heights (highest, wrist, and lowest).
|
Participant |
Gait Asymmetry Index (%) |
||
|
Highest |
Wrist |
Lowest |
|
|
1 |
135.60 |
149.46 |
149.53 |
|
2 |
22.73 |
52.26 |
29.01 |
|
3 |
215.32 |
219.70 |
198.04 |
|
4 |
38.00 |
80.65 |
0.59 |
|
5 |
120.75 # |
120.75 # |
67.96 |
DISCUSSION
Overall, the findings of this study show that walker height settings impact the spatiotemporal variables of the gait cycle. Studies report that higher variabilities in stride length are associated with gait impairment [7]. Our results show the largest variability in stride length at the highest walker height setting compared to the wrist and lowest setting, but there is no clear trend between the wrist and lowest height settings. While high and low variability in stride width have been associated with fall history in older adults [10]. Our study's findings showed no real trend in stride width variability across the different walker heights. However, the participants showed smaller steps with the highest and lowest walker settings compared to the wrist setting, and smaller steps have been associated with a more cautious ambulation with the potential to lead to falls or injury [2]. This variability in step length cannot be entirely attributed to the height setting, as the participants included in the study were merely
simulating walker use during the gait trials, which potentially introduced variations in stride length within each participant’s multiple trials.
Similar trends are observed in the temporal variables, i.e., stance time, swing time, and double limb support time. Overall, the participants had relatively larger stance times at the highest walker setting when compared to the wrist and lowest walker settings, with variations in all walker height settings. Studies have shown that increased stance time can be an indicator of fear while walking and/or an impaired balance [11], but the findings of our study cannot be associated with either, as our participants were healthy young adults simulating walker use. Additionally, decreased swing times and increased double limb support times can be associated with taking more time to stabilize the body during walking, and it could be indicative of fall risk [2], [7]. This is not reflected in our findings as they show relatively comparable swing times and double limb support times with similar variability for all participants across the different walker height settings.
The GAI values in Table 3 can provide insight into the overall gait performance. When this value equals zero, it is considered symmetrical gait. The larger the value, the more asymmetrical the gait [12]. The larger the asymmetry in gait, the less efficient the body’s performance, as asymmetric gait is associated with increased oxygen consumption and energy cost for locomotion [12]. The wrist setting had the largest gait asymmetry index out of the three heights for all participants, showing that it may not be the most effective height setting, emphasizing the need for better guidelines for walker use.
Overall, while some of our results agree with previous studies that conducted gait analyses among walker users, the lack of consensus in the results can be attributed to the participants being healthy young adults simulating walker use. Further data collection with real walker users is needed to confirm the results of this study and the current body of evidence in biomechanical analyses of walker users [2], [7], [10], [11], [12]. While our study does not provide sufficient evidence to determine the most effective walker height while using a rollator, it does lay the foundation for the next steps of this line of research.
REFERENCES
-
N. Salari, N. Darvishi, M. Ahmadipanah, S. Shohaimi, and M. Mohammadi, “Global prevalence of falls in the older adults: a comprehensive systematic review and meta-analysis,” J Orthop Surg Res, vol. 17, no. 1, p. 334, Jun. 2022, doi: 10.1186/s13018- 022-03222-1. Available: https://doi.org/10.1186/s13018-022-03222-1. [Accessed: Dec. 13, 2024]
-
H. (Howe) Liu, M. McGee, W. Wang, and M. Persson, “Comparison of gait characteristics between older rolling walker users and older potential walker users,” Archives of Gerontology and Geriatrics, vol. 48, no. 3, pp. 276–280, May 2009, doi: 10.1016/j.archger.2008.02.004. Available: https://www.sciencedirect.com/science/article/pii/S0167494308000472. [Accessed: Dec. 13, 2024]
-
H. Liu, P. Thomas, Y. Salem, K. Miller, and M. McGee, “Comparison of gait between walking up and down an incline with a walking device in older adults,” Geriatric Nursing, vol. 53, pp. 141–145, Sep. 2023, doi: 10.1016/j.gerinurse.2023.07.014. Available: https://www.sciencedirect.com/science/article/pii/S0197457223001805. [Accessed: Dec. 13, 2024]
-
B. A. West, G. Bhat, J. Stevens, and G. Bergen, “Assistive device use and mobility-related factors among adults
aged ≥ 65 years,” Journal of Safety Research, vol. 55, pp. 147–150, Dec. 2015, doi: 10.1016/j.jsr.2015.08.010. Available: https://www.sciencedirect.com/science/article/pii/S0022437515000791. [Accessed: Dec. 13, 2024]
-
H. (Howe) Liu, “Assessment of rolling walkers used by older adults in senior-living communities,” Geriatrics & Gerontology International, vol. 9, no. 2, pp. 124–130, 2009, doi: 10.1111/j.1447-0594.2008.00497.x. Available:
https://onlinelibrary.wiley.com/doi/abs/10.1111/j.1447-0594.2008.00497.x. [Accessed: Dec. 13, 2024]
-
C. Luz, T. Bush, and X. Shen, “Do Canes or Walkers Make Any Difference? NonUse and Fall Injuries,” The Gerontologist, vol. 57, no. 2, pp. 211–218, Apr. 2017, doi: 10.1093/geront/gnv096. Available: https://doi.org/10.1093/geront/gnv096. [Accessed: Dec. 13,
2024]
-
I. Härdi, S. A. Bridenbaugh, Y. J. Gschwind, and R. W. Kressig, “The effect of three different types of walking aids on spatio- temporal gait parameters in community-dwelling older adults,” Aging Clin Exp Res, vol. 26, no. 2, pp. 221–228, Apr. 2014, doi: 10.1007/s40520-014-0204-4. Available: https://doi.org/10.1007/s40520-014-0204-4. [Accessed: Dec. 13, 2024]
-
“Qualisys Track Manager (QTM),” Qualisys. Available: https://www.qualisys.com/software/qualisys-track-manager/. [Accessed: Dec. 13, 2024]
-
“Theia Markerless - Markerless Motion Capture Redefined.” Available: https://www.theiamarkerless.ca/. [Accessed: Dec. 13, 2024]
-
J. S. Brach, J. E. Berlin, J. M. VanSwearingen, A. B. Newman, and S. A. Studenski, “Too much or too little step width variability is associated with a fall history in older persons who walk at or near normal gait speed,” J NeuroEngineering Rehabil, vol. 2, no. 1, p. 21, Jul. 2005, doi: 10.1186/1743-0003-2-21. Available: https://doi.org/10.1186/1743-0003-2-21. [Accessed: Dec. 13, 2024]
-
D. A. Kegelmeyer, S. Parthasarathy, S. K. Kostyk, S. E. White, and A. D. Kloos, “Assistive devices alter gait patterns in Parkinson disease: Advantages of the four-wheeled walker,” Gait & Posture, vol. 38, no. 1, pp. 20–24, May 2013, doi: 10.1016/j.gaitpost.2012.10.027. Available: https://www.sciencedirect.com/science/article/pii/S0966636212004006. [Accessed: Dec. 13, 2024]
-
S. Viteckova, P. Kutilek, Z. Svoboda, R. Krupicka, J. Kauler, and Z. Szabo, “Gait symmetry measures: A review of current and prospective methods,” Biomedical Signal Processing and Control, vol. 42, pp. 89–100, Apr. 2018, doi: 10.1016/j.bspc.2018.01.013. Available: https://www.sciencedirect.com/science/article/pii/S1746809418300193. [Accessed: Dec. 13, 2024]