Classroom Accessibility Mobile Application: A Preliminary Investigation of Interrater Reliability for Accessibility of Classrooms on a Midwest Undergraduate Institution Campus
Sayeda F. Aktar1, Mason D. Drake2, Calvin Berndt1, Indira Wolski1, Iftekhar Anam1, Roger O. Smith2
1University of Wisconsin-Green Bay, 2University of Wisconsin-Milwaukee
ABSTRACT
Ensuring classroom accessibility is critical for fostering equitable learning opportunities in modern educational environments. This study evaluates the interrater reliability of the "Classroom Accessibility" mobile application at a Midwest undergraduate institution’s (MUI) campus. Two trained raters independently assessed accessibility features, including lighting and sound, across ten classrooms. The evaluations yielded Cohen's kappa scores ranging from 0.6352 to 0.7309, with six classrooms (MAC_103 to MAC_113) achieving strong agreement (κ = 0.7309) and the remaining four classrooms showing moderate agreement (κ = 0.6352–0.6795). These results demonstrate the application's reliability while also highlighting variability in certain classroom setups that may require methodological refinement. These findings highlight the potential of the Classroom Accessibility application as a reliable tool for evaluating classroom accessibility while identifying areas for methodological improvement to enhance evaluation consistency.
INTRODUCTION
According to the data from the National Center for Education Statistics, a significant proportion of college students, with approximately 20% of undergraduates and 12% of graduate students, disclosed having a disability [1, 2]. Additionally, a report from the same source highlighted that 15% of college students indicated the presence of behavioral conditions/impairments [1, 3, 4]. Though some mobile applications have been designed for accessibility evaluation to provide an efficient and standardized approach to assess facilities, however, their effectiveness depends on the reliability of data collected by different raters [6,7, 8, 10]. Interrater reliability is a critical measurement that determines the internal consistency of evaluations, highlighting the application’s utility for institutional assessments [10, 11, 12, 13].
This study examines the interrater reliability of data collected using the "Classroom Accessibility" mobile application at the MUI campus. Two raters assessed classrooms to determine the consistency of evaluations across ten classrooms. By measuring key accessibility factors such as lighting and sound, the study aims to validate the application's reliability and highlight areas for methodological refinement.
METHODOLOGY
Participants
Two raters independently assessed classroom accessibility features at MUI. Both raters were trained using the "ClassroomAUDIT_1.6-4" [5] Excel tool and the "Classroom Audit Manual" [6] to measure classroom accessibility. Additionally, they received training on the use of the "Classroom Accessibility" mobile application. Evaluations were conducted simultaneously to reduce variability in assessments.
Instrumentation
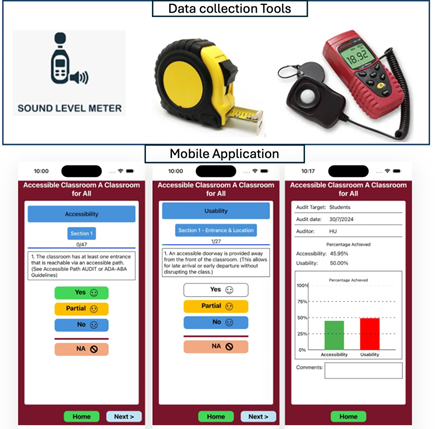
The study utilized the "Classroom Accessibility" mobile application, developed on the React Native platform, and deployed on two android tablets for data collection. The application consists of two primary sections: one focusing on accessibility and the other on usability. The accessibility section comprises 10 subsections with a total of 47 questions, addressing aspects such as classroom entrance, interior, sound, lighting, flooring, and more. The usability section includes 9 subsections with a total of 27 questions, each targeting specific usability factors. To ensure consistency in measurement, the raters used identical devices to assess parameters such as light and sound levels, seat height, and width. Evaluations were conducted across 10 classrooms, each featuring unique setups.
Rater’s training & data collection procedure
The data collection process involved two dedicated raters who invested 51 hours, comprising 10 hours of intensive training and 41 hours of data collection. One of the raters had prior experience with accessibility measurement applications, while the other was new to the process. During training, both raters engaged deeply with the Classroom_Audit Manual [6] and practiced extensively with the mobile application, carefully reviewing each question to comprehensively understanding evaluation criteria.
Following the training phase, the raters conducted evaluations across ten classrooms within a single academic building. The raters worked simultaneously to ensure consistency in environmental conditions, focusing on key variables
such as accessibility features, lighting, and sound levels. These parameters were systematically measured and recorded using the mobile application. The collaboration between a rater with prior expertise and one without highlighted the critical role of thorough preparation and teamwork in achieving reliable and accurate data collection outcomes.
DATA ANALYSIS
Cohen’s kappa scores for the 10 classrooms (different setup):
Interrater reliability was assessed using Cohen’s kappa statistic, a robust measure of agreement for categorical data. Scores were calculated for each classroom, with κ > 0.70 indicating strong agreement, 0.60 < κ < 0.70 representing moderate agreement, and κ < 0.60 indicating low agreement [ 11, 12, 13].
RESULT
The interrater reliability analysis yielded the following
Table 1. Example of a table heading
| Classroom Number | Cohen_Kappa Score |
| MAC_103 | 0.7309 |
| MAC_105 | 0.7309 |
| MAC_107 | 0.7309 |
| MAC_109 | 0.7309 |
| MAC_111 | 0.7309 |
| MAC_113 | 0.7309 |
| MAC_122 | 0.6684 |
| MAC_229 | 0.6795 |
| MAC_236 | 0.6352 |
| MAC_237 | 0.6751 |
The trends in the Cohen Kappa scores across classrooms provide insights into the level of agreement between reviewers for each classroom:
High Agreement (MAC_103 to MAC_113):
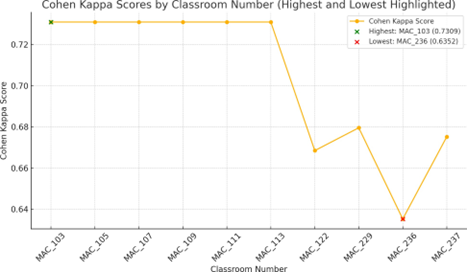
The first six classrooms (MAC_103, MAC_105, MAC_107, MAC_109, MAC_111, MAC_113) exhibit a consistent and high level of agreement, with Cohen Kappa scores all at 0.7309. This suggests a strong and reliable consensus among reviewers for these classrooms. It may indicate that the features or conditions in these classrooms are easier to evaluate consistently.
Moderate Agreement (MAC_122, MAC_229, MAC_236, MAC_237):
The remaining classrooms show slightly lower but still reasonable agreement, with scores ranging from 0.6352 (MAC_236) to 0.6795 (MAC_229). MAC_122 has a lower score of 0.6684, and MAC_237 is close at 0.6751. These values indicate that while there is still agreement, the level is not as strong as in the first group of classrooms. This may suggest variability in the evaluation criteria or potential challenges in interpreting or observing the features in these classrooms.
Possible Reasons for the Trends:
It is plausible the classrooms with high levels of agreement all possessed similar layouts and displayed minimal variability amongst each other. The classrooms with lower interrater agreement may have been unique in their structure, which led to subjectivity when evaluating and causing more variability between evaluators.
Room Characteristics:
Classrooms with uniform design and conditions (e.g., accessibility features, layout) likely lead to higher agreement, as seen in MAC_103 to MAC_113. Variability in design or features, as might be the case in MAC_122 and MAC_236, could lead to less consistent evaluations.
Subjectivity in Evaluation:
Some features or conditions might require subjective judgment, leading to differing interpretations among reviewers.
Training or Reviewer Experience:
The consistency of high scores in some classrooms suggests well-aligned training or experience among reviewers for certain types of environments.
Collectively, classrooms MAC_103 to MAC_113 show excellent agreement, while classrooms MAC_122 to MAC_237 highlight areas where variability in evaluation might be higher, potentially due to room-specific challenges or differences in interpretation. Addressing these factors with additional accessibility training could improve agreement levels between raters.
ACKNOWLEDGEMENT
The work on the Classroom Accessibility project was supported by the WySis Spark Grant 2024. This project also partially relied on the Access Rating for Buildings project, which was funded by grants from the National Institute on Disability, Independent Living, and Rehabilitation Research (NIDILRR), grant numbers 90IFDV0006 and H133G100211. NIDILRR is a center within the Administration for Community Living (ACL), part of the Department of Health and Human Services (HHS). The contents of this work do not necessarily
represent the policy of NIDILRR, ACL, or HHS, and should not be interpreted as an endorsement by the Federal Government.
CONCLUSION
In summary, the analysis of ten classrooms on the MUI campus revealed a high level of agreement for certain classrooms (MAC_103 to MAC_113), with Cohen's kappa scores consistently at 0.7309, indicating strong reliability. These results suggest that certain classroom designs and accessibility features are easier to evaluate consistently, likely due to uniformity and clarity in their attributes.
Overall, this investigation demonstrates that the "Classroom Accessibility" mobile application is a valuable tool for institutional assessments, providing reliable data for most classrooms. However, addressing the variability observed in certain cases will be critical for maximizing the application’s effectiveness and ensuring equitable accessibility evaluations. Future research should focus on refining evaluation protocols, exploring the impact of room-specific characteristics, and standardizing reviewer training to enhance interrater reliability further.
REFERENCES
- Table 311.10. Number and percentage distribution of students enrolled in postsecondary institutions, by level, disability status, and selected student characteristics: 2015-16. National Center for Education Statistics. May 2018. https://nces.ed.gov/programs/digest/d20/tables/dt20_311.10.asp.
- American College Health Association. (2022). American College Health Association-National College Health Assessment III: Undergraduate Student Reference Group Data Report Spring 2022 [PDF]. Silver Spring, MD: American College Health Association. Retrieved from https://www.acha.org/documents/ncha/NCHA-III_SPRING_2022_UNDERGRAD_REFERENCE_GROUP_DATA_REPORT.pdf
- Table: Bachelor's degree attainment at first institution through June 2017 by Disability. U.S. Department of Education, National Center for Education Statistics, Beginning Postsecondary Students: 2012/2017. Accessed March 2023. https://nces.ed.gov/datalab/membership/login
- Use of Supports Among Students With Disabilities and Special Needs in College. National Center for Education Statistics at Institute of Education Sciences. April 2022. https://nces.ed.gov/whatsnew/press_releases/4_26_2022.asp.
- R2D2 Center. (n.d.). Access-ed: Promoting accessibility in education. Retrieved from https://access- ed.r2d2.uwm.edu.
- R2D2 Center. (n.d.). ClassroomAUDIT (Version 1.6) [Excel spreadsheet]. Retrieved from https://access- ed.r2d2.uwm.edu/resources/ClassroomAUDIT_1.6.xls.
- R2D2 Center. (2010). Classroom audit manual [PDF]. Retrieved from https://access- ed.r2d2.uwm.edu/resources/Classroom_audit_manual_2010-8-13.pdf.
- Finnis, E., Howell, J., & Gorrie, R. (2014). Some reflections on improving accessibility and the classroom experience. Transformative Dialogues: Teaching and Learning Journal, 7(3).
- Mendonca, R. J., Ardehali, M. M., Aktar, S. F., & Smith, R. (2023). Interrater reliability of the med-audit (medical equipment device–accessibility and universal design information tool).
- Aktar, S. F., Drake, M. D., Tian¹, S., Smith, R. O., & Ahamed¹, S. I. (2024). A Machine Learning-Based Approach to Enhance the Accuracy of Sound Measurements in iOS Devices for Accessibility Applications.
- Kushalnagar, R. (2019, October). A classroom accessibility analysis app for deaf students. In Proceedings of the 21st International ACM SIGACCESS Conference on Computers and Accessibility (pp. 569-571).
- Browning, E. R., & Cagle, L. E. (2017). Teaching a “Critical Accessibility Case Study” Developing Disability Studies Curricula for the Technical Communication Classroom. Journal of Technical Writing and Communication, 47(4), 440-463.
- McHugh ML. Interrater reliability: the kappa statistic. Biochem Med (Zagreb). 2012;22(3):276-82. PMID: 23092060; PMCID: PMC3900052.