Analysis of functional mobility assessment outcomes measures at a wheelchair clinic
J. Diawara1,3, D. Chavan 2, G. Frey 1, C. DiGiovine 1,3, A. Mhatre1,3
1 The Ohio State University, School of Health and Rehabilitation Sciences
2 The Ohio State University, College of Arts and Sciences
3 The Ohio State University Wexner Medical Center, Assistive Technology Center
INTRODUCTION
Functional mobility is an essential skill for the performance of activities of daily living. For many individuals with physical disabilities, wheeled mobility and seating (WMS) devices are necessary to increase independence in daily mobility. Therefore, the service delivery process for these products and the subsequent user’s ability and satisfaction with their equipment is crucial to improve clients’ quality of life and overall participation. One aspect of service delivery that is often insufficient is client follow-up. Ensuring user satisfaction throughout the service delivery process, including the follow-up, maintenance, and repair components following the wheelchair delivery, reduces equipment abandonment and improves feature matching to fit the client’s needs within their environment [5]. One domain of follow up that can be assessed is the patient experience, which can be directly gathered through client self-report assessment. Utilizing these patient-report outcomes can serve as an effective data source to inform clinicians of the long-term effects of their clinical proceedings and potential quality improvement [1].
The Functional Mobility Assessment (FMA) is one outcome, performance-based self-report measure that can be used to assess the domains of ability and satisfaction from a patient’s perception. This tool was created by the University of Pittsburgh to provide clinicians with a quick and efficient tool to quantify wheeled mobility and seating (WMS) satisfaction and user abilities [2]. Paulisso et al. (2021) determined that the FMA produced high reliability and consistency in reporting wheeled mobility skills in a clinical practice setting [3]. FMA also demonstrated high test-retest reliability through a cohort study using both non-WMS and WMS users. Participants scores exceeded the 0.80 value for clinical assessment tools [2].
The purpose of this research is to highlight the impact of seating and mobility equipment interventions performed at the Ohio State University Assistive Technology Clinic (AT Center) with the use of the FMA to inform quality improvement programming. The first objective of the study was to evaluate the association between the demographic variables and the FMA outcome. The second objective was to evaluate the differences in the FMA outcome over time. Our null hypothesis stands that the FMA score remains the same over the recorded time points .
METHODS
Research Design
Individuals receiving seating and wheeled mobility services through The Ohio State University Wexner Medical Center (OSUWMC) - Assistive Technology Center (ATC) received up to eight surveys recording eight time periods assessing their satisfaction with the seating and mobility interventions. Patient demographic data and initial survey scores were obtained upon patient's initial evaluation appointment at the ATC. Intake and FMA data were sent to U.S Rehab, an outside entity of The Ohio State University Wexner Medical Center with the role of administering the FMA survey. Up to seven additional surveys were sent to patients starting at 21 days post seating equipment delivery followed by 90, 180, 365, and annually thereafter. U.S Rehab supplied the clinic with the FMA outcome data, which is used as part of the ATC quality improvement program. Data analysis covered the time span of the initial evaluation, follow-up appointments, equipment delivery and fitting, and post-delivery appointments. Demographic information collected includes a patient’s ethnicity, gender, age, height, weight, BMI, primary diagnosis, employment status, and source of funding. Pearson correlation tests were conducted to determine relationships between height, weight, and age vs FMA score.
Procedure

Patient demographic data was categorized and formatted to represent percentages of the population for all demographic information. To perform statistical analysis of FMA scores, the data was cleaned through a multi-step process. Python along with Microsoft Excel was used to filter out any extrema values in the dataset. Any duplicate/misspelled data entries were deleted/modified respectively. Open-source python libraries such as Pandas, SciPy, Statsmodels, Seaborn, and Matplotlib were used to effectively clean and visualize the dataset. Furthermore, a single factor ANOVA was used to identify statistical significance with time one through eight FMA scores to test the null hypothesis. If significant differences existed, a post hoc Tukey test was used to identify where potential significance lies between the FMA score means of each time. Quantitative data comparisons such as height, weight, and age vs FMA were performed with ordinary least squares regression.
RESULTS
The sample includes 4097 patients represented by 56% female and 43% male. Ethnicity representation includes 64% White/Caucasian, 24% Black/African American, 1% Asian, and 10% as other/missing. Predominant diagnoses include osteoarthritis, cerebral palsy, cardiopulmonary disease, spinal cord injury, and stroke/cerebrovascular accident (Figure 1). All other diagnosis were grouped together and labeled as “other”. A post hoc Tukey Test derived from a single factor ANOVA was used to identify potential significance within the FMA scores. The null hypothesis was rejected (p<.05) and reflected through T1-T5. Table 1 highlights T1 (evaluation) - T5 (365 days post-delivery), which includes 310 patients, highlighting significance lies with comparisons between the first and latter FMA scores.
Correlation analyses demonstrated that weight and age have a weak, negative correlation. As weight and age increases, FMA score tends to decrease, r (4087) = -0.11 to -0.16, p<.05.
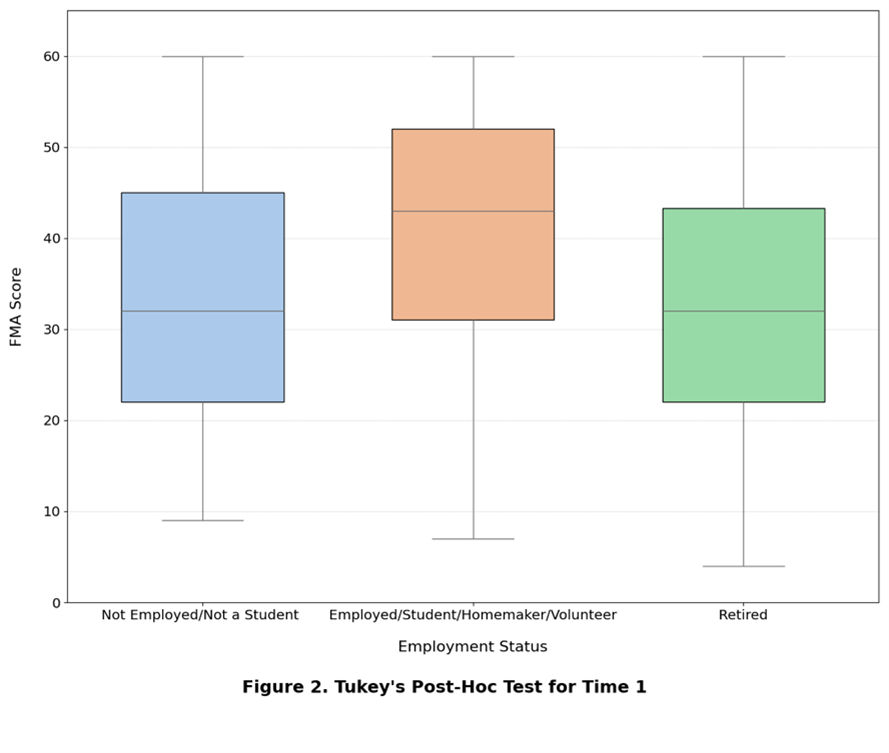
The relationship between FMA score and employment was analyzed by conducting Tukey’s Post-Hoc test. Patients who were either employed, a student, homemaker, or volunteer had a significantly higher FMA scores than individuals who were either not employed/student or retired (Figure 2).
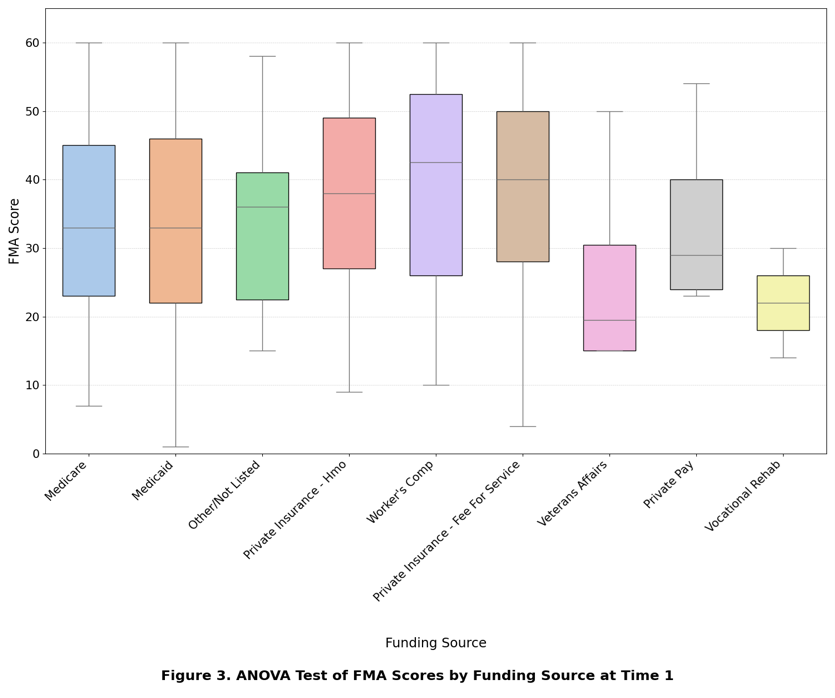
Furthermore, an Ordinary Least Squares Regression was performed to dive deeper into the relationship between employment and FMA scores. Individuals in the not employed/student group tend to have on average a FMA score that is 3.63 points lower than the Employed/Student/Homemaker/Volunteer group. Individuals who are retired have a FMA score that is 4.4 points lower than the Employed/Student/Homemaker/Volunteer group. To determine the association between Funding source and FMA score, an ANOVA test was conducted (Figure 3). As a result, there is a significant relationship between the various funding sources. To further dissect the difference, Tukey’s Post-Hoc test was performed. In conclusion, patients who had private insurance had a significantly higher FMA score than those who had public insurance. Additionally, Medicare users had a significantly higher FMA score than Medicaid users. Diving deeper into this comparison, a two-sample t-test was conducted to see if age and FMA score played a role in private vs public funding since age had a negative relationship with FMA score. As a result, based on high t-statistic and low p-value people who have public insurance tend to be significantly older than people who have private insurance during the first time interval. Therefore, age may be playing a role in the difference in scores between private and public insurance.
|
Interval |
Average |
Standard |
|
T 1 (Evaluation) |
34.4 |
13.8 |
|
T 2* 21 Days |
54.0 |
7.4 |
|
T 3* 90 Days |
54.2 |
7.4 |
|
T 4* 180 Days |
54.4 |
6.9 |
|
T 5* 365 Days |
53.3 |
9.3 |
Note: * denotes statistical significance
DISCUSSION
The results of the present study support the reliability and validity of the FMA tool to report client outcomes following WMS service delivery. The demographic variables of employment status and funding source demonstrated statistical significance between groups at baseline time 1. These variables were analyzed to see how various socioeconomic factors may influence a client’s satisfaction with their mobility device. This could provide insight on whether there are disparities between funding sources or employment for patient outcome measures. FMA scores reflect that components of the service delivery process, assistive technology personnel, and seating equipment contribute to a significant change in score over time. Further studies would need to be conducted to measure which step, or steps, of the service delivery process would be the defining factor of the change in FMA score. This pattern of results is consistent with the previous literature, highlighting the effectiveness of the FMA to track WMS service delivery process through patient-perceived outcomes [2,4].
Isolating the interval of initial evaluation (time 1) and device delivery (time 2) provides valuable insights and implications for service delivery for a variety of stakeholders including clients, clinicians, and insurance providers. Deeper knowledge of the significance of this period and the interventions provided is needed to further examine this significant gain in patient satisfaction and mobility. Additionally, these findings may translate into investigation regarding the consistent FMA score for Time 2 and each subsequent follow up.
Present limitations of the study include the high rate of patient response drop-off throughout the course of eight surveys. Several factors may have influenced the lack of continued patient response, such as loss of contact, device abandonment, or other logistical barriers [4]. Further research is needed to determine the impact of other demographic characteristics and lack of continue patient-report scores to implement quality improvement recommendations and subsequent clinical outcomes. Deeper analysis may be warranted to examine explicit indicators for a change in outcome scores.
Our findings highlight the importance of reliable assessment tools to ensure patient satisfaction and usage of their device is maximized. Additionally, any decreases in satisfaction can be noticed to prevent user injuries, preventable damage and repairs, and device abandonment as part of a quality improvement program. Finally, clinicians can utilize the findings of this study to weigh the impact of demographic and socioeconomic status on wheelchair users’ perception of their mobility and device satisfaction.
REFERENCES
-
Faieta, J., Schmeler, M. R., Schiappa, V. J., Hand, B. N., Schein, R. M., Saptono, A., Berner, T., & DiGiovine, C. P. (2019). Evaluation of Service Delivery Effectiveness Through Patient-Reported Outcome Measures. American Journal of Physical Medicine & Rehabilitation, 98(12), 1072–1078.
-
Kumar, A., Schmeler, M. R., Karmarkar, A. M., Collins, D. M., Cooper, R., Cooper, R. A., Shin, H., & Holm, M. B. (2013). Test-retest reliability of the functional mobility assessment (FMA): a pilot study. Disability and rehabilitation. Assistive technology, 8(3), 213–219.
-
Paulisso, D. C., Schmeler, M. R., Schein, R. M., Allegretti, A. L. C., Campos, L. C. B., Costa, J. D., Fachin- Martins, E., & Cruz, D. M. C. D. (2021). Functional mobility assessment is reliable and correlated with satisfaction, independence and skills. Assistive technology : the official journal of RESNA, 33(5), 264–270.
-
Stojkov, A. D., Schein, R. M., Berner, T., Beauregard, T., & DiGiovine, C. P. (2022). Common reasons for non-participation during the outcome measurement process: Wheeled mobility service delivery quality improvement reporting. Disability and Rehabilitation: Assistive Technology, 0(0), 1–7.
-
RESNA Wheelchair Service Provision Guide. RESNA, 26 Jan. 2011,
https://www.resna.org/Portals/0/Documents/Position%20Papers/RESNAWheelchairServiceProvisionGuide.pdf.
Acknowledgement
Acknowledgements go to Matthew Yankie, PT, DPT, ATP