Jacob Misch![]() 1
1![]() , Hunter Kim
, Hunter Kim![]() 1
1![]() , Stephen Sprigle, PT PhD
, Stephen Sprigle, PT PhD![]() 1
1![]()
![]() 1
1![]() Rehabilitation Engineering and Applied Research (REAR) Lab, Georgia Institute of Technology (Atlanta, GA)
Rehabilitation Engineering and Applied Research (REAR) Lab, Georgia Institute of Technology (Atlanta, GA)
INTRODUCTION
Not all wheelchairs are built the same. In fact, full-time wheelchair users often require custom-build wheelchairs to minimize risk of injury or strain on the upper body. A myriad of customization options exists including seat size, frame angle, axle position, tire type, and frame weight. According to the Healthcare Common Procedure Coding System (HCPCS), a generic standard wheelchair used mainly for short-term use with brief durations of assisted travel (HCPCS K0001) is typically over 36 lbs. Alternatively, a specialized ultralightweight wheelchair for unassisted full-time use (K0005) must be under 30 lbs. [1] The main differences between the two categories are the strength of the frame and the total mass, but it is unclear if mass can, or should, be related to performance.
Wheelchair mass directly affects transportation of the chair. However, it also influences the dynamics of the system – heavier chairs require more torque on each wheel to accelerate [2] and experience greater energy loss at the wheels due to the larger forces acting on them. [3, 4] With such small weight changes, this effect may be subtle enough that it might go unnoticed during short-term tests at constant velocities, but if the user must accelerate extra mass during every push, the cumulative cost of propelling a heavier chair may become noticeable over time. The problem is that this increased mechanical cost is difficult to isolate, as even large mass differences can be overshadowed by other factors like weight distribution (WD) during human subject testing. [5]
The objective of this paper was to introduce a highly repeatable, robotic method for investigating the influence of changes in mass and WD on manual wheelchair propulsion over a straight, flat tile surface.
METHODS
The manual wheelchair used for this study was an ultralightweight frame (Quickie GT, Sunrise Medical) equipped with 5"x1" solid polyurethane Primo casters and 24"x1-3/8" spoked pneumatic Primo Orion drive wheels at 75 psi.
Robotic Propulsion System
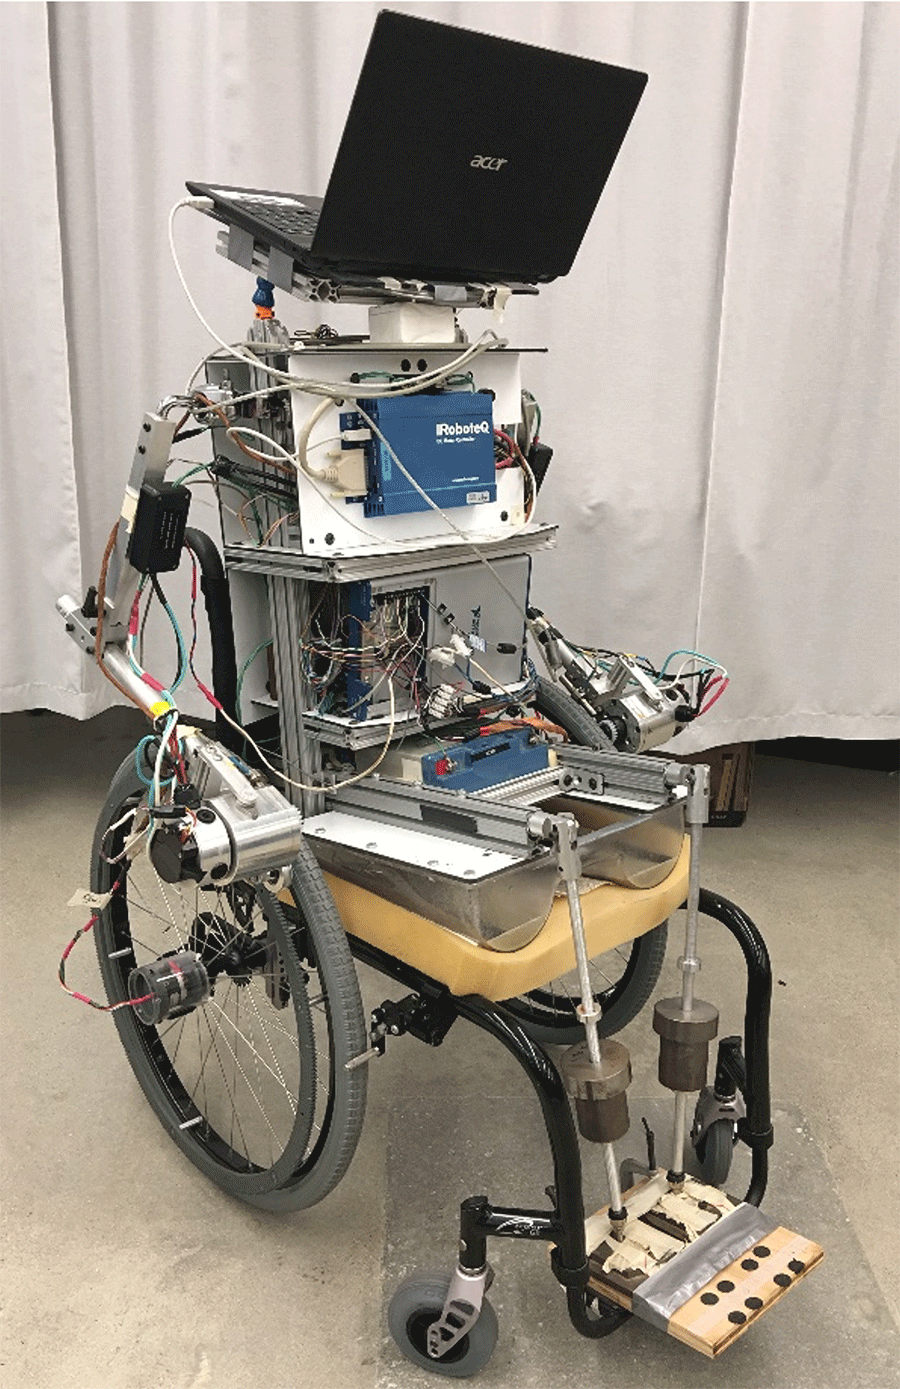
The Anatomical Model Propulsion System (AMPS, seen in Figure 1) was created to act as a substitute for human wheelchair users. Its design mimics the body segment mass and location parameters of an adult male as defined by anthropometric sources and can be loaded into nearly any manual wheelchair. The main chair modification is that the standard cylindrical push-rims are replaced with custom-made ring gears that are similar in size and weight. Brushed DC motors act as the hands of the user and mesh directly with the ring gears. Specialized shaft-mounted clutches transfer torque directly from the motor to the push-rims of each wheel and allow the wheels to spin freely when the motors are idle. A more complete description and validation of the AMPS can be read in [6].
The control system is comprised of an onboard data acquisition system (NI USB-6341, National Instruments) and a high-powered motor controller (HDC-2460, Roboteq Inc). Current and voltage sensors record the output of each motor at a sampling rate of 40 Hz. These values are directly proportional to the torque and angular velocity outputs of the motors, respectively. The axle-mounted optical wheel encoders are used to measure the relative angular position of each wheel and can be used to determine both wheel velocity and the distance traveled by the wheelchair system over time.
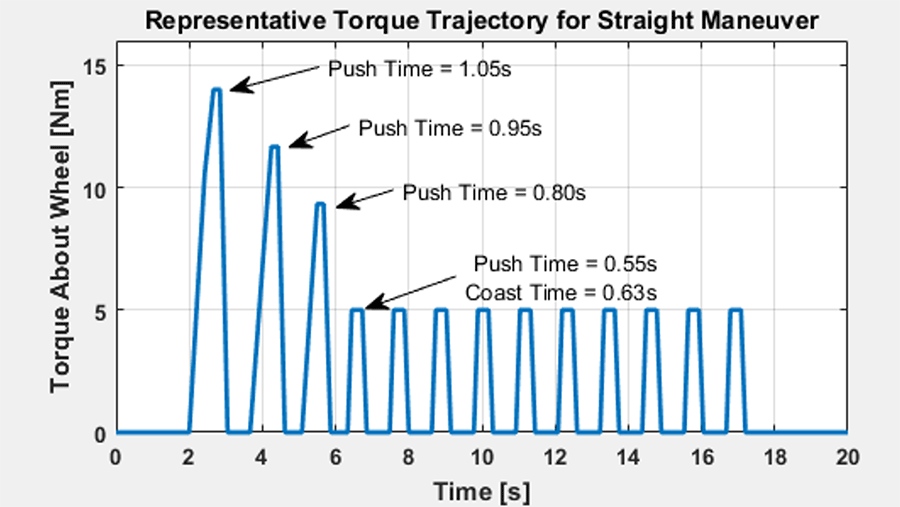
Motor torque is applied to each wheel according to a standardized, pre-defined trajectory (seen in Figure 2). The first three pushes accelerate the system towards a steady-state velocity around 0.85m/s. The torques are then reduced to maintain the steady-state velocity. The chair may either accelerate or decelerate slightly within the first 5 pushes of this steady-state phase, and typically establishes a steady state velocity by the latter half of the steady state. This trajectory is transmitted from a laptop running LabVIEW (LV2019, National Instruments) to the motor controller. Motor current measurements from Hall-effect sensors are used as feedback signals to estimate the physical torque output of each motor. This method results in a highly controlled, repeatable application of torque about the wheels, to model human wheelchair dynamics.
Experimental Design
| Name | Configuration | System Mass | WD over Drive Wheels |
|---|---|---|---|
| 0S, 0F | 0 kg Shelf, 0 kg Footrest | 93.6 kg | 71.9 % |
| 2S, 0F | 2 kg Shelf, 0 kg Footrest | 95.6 kg | 72.0 % |
| 4S, 0F | 4 kg Shelf, 0 kg Footrest | 97.6 kg | 72.0 % |
| 0S, 2F | 0 kg Shelf, 2 kg Footrest | 95.6 kg | 68.7 % |
| 0S, 4F | 0 kg Shelf, 4 kg Footrest | 97.6 kg | 65.7 % |
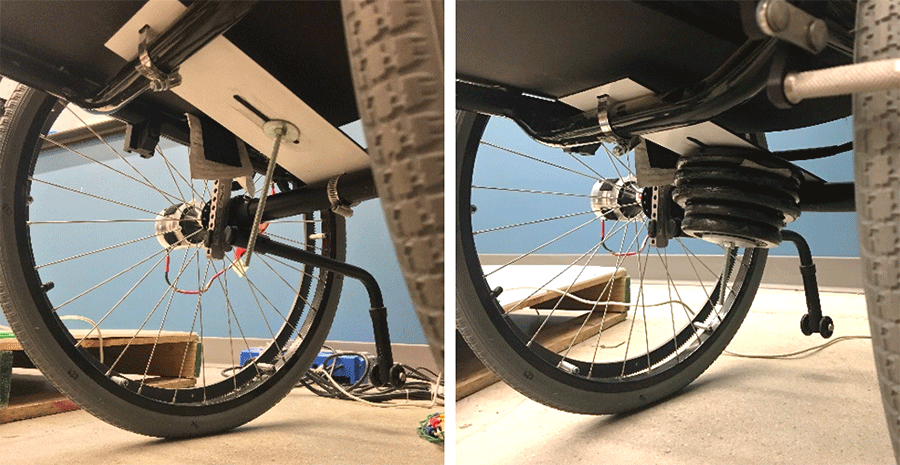
Two factors were considered in this study: total system mass and the WD between the front casters and rear drive wheels. Both parameters were measured by loading the AMPS and wheelchair on the iMachine. [7] The selected 'default' configuration was defined as 93.6 kg total mass, which includes the AMPS and the entire wheelchair, with 28.1% of the weight over the casters and 71.9% distributed over the drive wheels. To accommodate incremental mass changes, a lightweight Dibond shelf was fastened to the chair frame with a slot cut down the midline, as seen in Figure 3. Discrete metal weights were secured by a bolt in this channel and adjusted to match the center of mass location. Loads added to the chair at this neutral axis had minimal effect on the WD. Placing the same weights on the footrest, however, had pronounced effects, as noted in Table 1. Using the HCPCS-defined weight limits for the K0001-K0005 wheelchair categories from [1], five configurations were established. The default configuration with no added weights represents the ultralightweight wheelchair. The +2 kg and +4 kg configurations span into the lightweight and standard wheelchair categories. The placement of the weights directly influences the WD, with higher percentages associated with lower system rolling resistances. [4]
Fifteen trials were performed with each configuration over a flat linoleum tile floor. The trials were averaged over each configuration. The repeatability for each set of fifteen trials was assessed during testing, with all metrics typically falling well below 10% coefficient of variation.
Analysis
The fundamental work-energy principle states that the amount of work provided to a system equals a corresponding change in the kinetic energy. As the AMPS is exposed to non-conservative forces such as rolling resistance during maneuvers, a loss term must be added to account for any supplied energy that was not transferred to the motion. Therefore, the amount of work, in Joules, can be expressed as:
(1) |
The power input to the system, in Watts, is the product of the torque at the wheel in Nm and the angular velocity of the wheel in rad/s. The total power into the AMPS is the summation of the left and right wheel power:
(2) |
Data were processed in Matlab (R2019b, MathWorks Inc). Each trial was first split into an acceleration phase and a steady-state phase, then further segmented into pushes and coasts. The work, distance, and kinetic energy at each phase transition were recorded for each trial and averaged across each configuration. A measure of propulsion cost was established to describe the amount of energy that is lost per meter traveled:
(3) |
In this equation, the change in kinetic energy during the phase is subtracted from the supplied work to yield the total energy lost for that phase, which is then normalized over the distance (S) traveled by the system, in meters.
RESULTS
The collected data was used to calculate the propulsion cost, the average (![]() ) and change in kinetic energy (
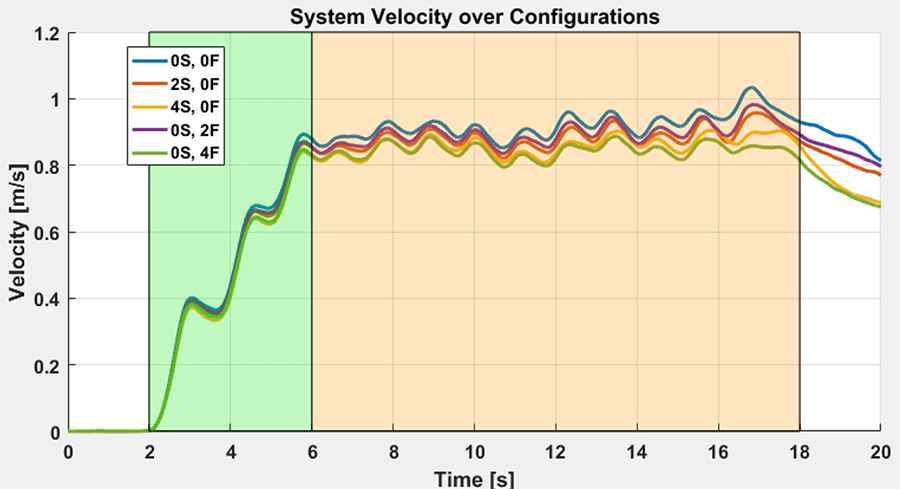
) and change in kinetic energy (![]() ) during the acceleration and steady-state phases. Basic descriptive statistics are shown in Table 2 and Table 3, as well as Cohen's d effect size and percent change calculated with respect to the default configuration. Figure 4 shows the averaged velocity of each configuration during the maneuver.
) during the acceleration and steady-state phases. Basic descriptive statistics are shown in Table 2 and Table 3, as well as Cohen's d effect size and percent change calculated with respect to the default configuration. Figure 4 shows the averaged velocity of each configuration during the maneuver.
|
Acceleration Phase: Cost [J/m] | Steady-State Phase: Cost [J/m] | ||||||
|---|---|---|---|---|---|---|---|---|
| Config | Mean | StDev | Effect Size | % Change | Mean | StDev | Effect Size | % Change |
| 0S, 0F | 6.83 | 0.48 | - | - | 9.63 | 0.26 | - | - |
| 2S, 0F | 6.89 | 0.28 | 0.15 | +0.84 % | 10.16 | 0.36 | 1.68 | +5.51 % |
| 4S, 0F | 6.99 | 0.44 | 0.34 | +2.32 % | 10.33 | 0.18 | 3.13 | +7.28 % |
| 0S, 2F | 7.08 | 0.53 | 0.49 | +3.58 % | 10.10 | 0.28 | 1.71 | +4.85 % |
| 0S, 4F | 7.11 | 0.55 | 0.53 | +4.00 % | 10.77 | 0.33 | 3.82 | +11.83 % |
|
Acceleration Phase: Δ Kinetic Energy [J] | Steady-State Phase: Average Kinetic Energy [J] | ||||||
|---|---|---|---|---|---|---|---|---|
| Config | Mean | StDev | Effect Size | % Change | Mean | StDev | Effect Size | % Change |
| 0S, 0F | 37.23 | 0.87 | - | - | 43.39 | 1.50 | - | - |
| 2S, 0F | 35.86 | 1.11 | 1.37 | -3.67 % | 42.25 | 1.18 | 0.84 | -2.62 % |
| 4S, 0F | 34.43 | 0.77 | 3.40 | -7.50 % | 42.23 | 1.81 | 0.70 | -2.68 % |
| 0S, 2F | 36.08 | 1.12 | 1.14 | -3.07 % | 41.96 | 1.19 | 1.06 | -3.29 % |
| 0S, 4F | 34.77 | 1.15 | 2.41 | -6.60 % | 40.36 | 0.92 | 2.43 | -6.97 % |
DISCUSSION
The small standard deviations of the means demonstrate the high repeatability of the AMPS. In every reported case, the coefficients of variation are below 10%. Overall, changes in the calculated propulsion cost showed that there are small but appreciable differences between the tested configurations. In the acceleration phase, incremental mass alone had a small (0.2 to 0.5) effect size and increased the cost as much as 2.32%. Placing the same weights on the footrest, however, increased the cost even further to 4.00%, and had a medium (0.5) effect size. The trend during the steady-state phase is similar. Every shift had large effect sizes (over 0.8) and large percent differences over the cost of the default configuration, but the WD had a much larger impact on the cost at the higher mass. The WD with the greatest load over the casters required 11.83% more work (in Joules) per meter. These trends are generally in agreement with previous studies that reported decreasing WD load on the casters vastly increases rolling resistance forces. [2, 4] During acceleration, it was expected that increasing mass would have the greatest effect on propulsion cost, but the narrow differences in cost made it difficult to compare and identify trends.
Kinetic energy was analyzed to supplement the propulsion cost. The acceleration cost, counter-intuitively, is smaller than the steady-state cost for all configurations in Table 2 because these cost values account for changes in kinetic energy during the phase of interest. Most of the work during the acceleration phase is spent increasing the kinetic energy, whereas steady-state work is spent maintaining velocity and fighting resistive energy losses with little to no net gain in kinetic energy. The "raw" propulsion cost without subtracting ![]() is around 30 J/m for acceleration and only 10 J/m for steady-state. Therefore, the net
is around 30 J/m for acceleration and only 10 J/m for steady-state. Therefore, the net ![]() over the first three pushes of the acceleration phase were measured, as well as
over the first three pushes of the acceleration phase were measured, as well as ![]() for the entire steady-state phase as shown in Table 3 and Figure 4.
for the entire steady-state phase as shown in Table 3 and Figure 4.
In the acceleration phase, the ![]() scaled primarily with mass, meaning that lighter systems consistently accelerated faster and to a greater top speed than the heavier chairs. Changing the WD increased the effect sizes but had minimal impact on the
scaled primarily with mass, meaning that lighter systems consistently accelerated faster and to a greater top speed than the heavier chairs. Changing the WD increased the effect sizes but had minimal impact on the ![]() values themselves when compared to the impact of purely increasing mass without WD shifts. These findings align with a previous report that the mass primarily governs the torque required to accelerate a wheelchair. [2] In the same report, the torques during steady-state were closely matched at 70% WD regardless of weight, but demonstrated drastic differences when 5.5 kg was added to the system at 55% WD. The
values themselves when compared to the impact of purely increasing mass without WD shifts. These findings align with a previous report that the mass primarily governs the torque required to accelerate a wheelchair. [2] In the same report, the torques during steady-state were closely matched at 70% WD regardless of weight, but demonstrated drastic differences when 5.5 kg was added to the system at 55% WD. The ![]() values seen in Table 3 follow that relationship; each configuration has 3% lower
values seen in Table 3 follow that relationship; each configuration has 3% lower ![]() than the default configuration except the heavier, front-loaded chair, which is is endowed with almost 7% less kinetic energy under the exact same propulsion torque trajectory.
than the default configuration except the heavier, front-loaded chair, which is is endowed with almost 7% less kinetic energy under the exact same propulsion torque trajectory.
Lastly, the velocities of each configuration are shown in Figure 4. During acceleration, the velocities are tightly grouped, with slight separations between mass groups. It appears that the velocities continue to diverge between masses throughout the steady-state phase. The difference between mass-matched configurations is about 5% on average and reaches nearly 20% at the final push of steady-state. One explanation for this behavior is that idealized steady-state velocities would require identical acceleration and decelerations before and after each push. If the lighter chair puts less load on the components and experiences less rolling resistance, then the steady-state phase may show slight acceleration, whereas heavier chairs may decelerate slightly due to the same principle. WD appears to have a similar relationship to a lesser extent.
CONCLUSION
Incremental changes in the mass and weight distribution of a manual wheelchair have slight but appreciable effects on the mechanics of the vehicle. The robotic wheelchair propulsion system was used to apply a controlled torque profile to a series of configurations on the same wheelchair. Adding +2 kg to the chair at the center of mass increased the steady-state cost by over 5% and reduced the overall kinetic energy by roughly 3%. Doubling the added weight to +4 kg further decreased the capacity to accelerate and lowered the steady-state speed, increasing propulsion cost to the user. Moving the added masses from the center of mass to the footrest, effectively shifting 3-6% more of the weight distribution over the casters, made these effects more apparent. In some cases, the effects were even doubled.
This investigation of mass and weight distribution furthers our understanding of one of many facets of wheelchair propulsion, but it is far from all-encompassing. Other factors such as wheel selection, tire material, [4] tire inflation values, [5] and surface type [2] are often reported to have far greater effects on measurable performance metrics than the incremental changes discussed in this report.
REFERENCES
- Manual Wheelchairs Local Coverage Determination (LCD) and Policy. Center for Medicare and Medicaid Services. 2019, Noridian Healthcare Solutions, LLC.
- Sprigle S, Huang M. Impact of Mass and Weight Distribution on Manual Wheelchair Propulsion Torque. Assist Technol, 2015. 27(4):226-35.
- Lin JT, Huang M, Sprigle S. Evaluation of wheelchair resistive forces during straight and turning trajectories across different wheelchair configurations using free-wheeling coast-down test. Journal of Rehabilitation Research and Development, 2015. 52(7):763-774.
- Sprigle, S, Huang M, Misch J. Measurement of rolling resistance and scrub torque of manual wheelchair drive wheels and casters. Assist Technol, 2019.
- de Groot S, Vegter RJ, van der Woude LH. Effect of wheelchair mass, tire type and tire pressure on physical strain and wheelchair propulsion technique. Med Eng Phys, 2013. 35(10):1476-82.
- Liles H, et al. Design of a Robotic System to Measure Propulsion Work of Over-Ground Wheelchair Maneuvers. IEEE Trans Neural Syst Rehabil Eng, 2015. 23(6):983-91.
- Eicholtz MR, et al. Test method for empirically determining inertial properties of manual wheelchairs. J Rehabil Res Dev, 2012. 49(1):51-62.