Brandon Biggs![]() 1
1![]() , James M. Coughlan
, James M. Coughlan![]() 1
1![]() , Peter Coppin
, Peter Coppin![]() 2
2![]()
![]() 1
1![]() Smith-Kettlewell Eye Research Institute (San Francisco),
Smith-Kettlewell Eye Research Institute (San Francisco), ![]() 2
2![]() OCAD University (Toronto)
OCAD University (Toronto)
INTRODUCTION
Non-visual maps have been primarily made as raised line graphics with braille, but recent research has suggested that 3D models and interactivity make maps more accessible and easier to understand for non-visual users. This paper describes the design and evaluation of an interactive 3D map, which is a scale model of an environment with objects on it that play audio labels when a user points to them. In this study, we designed the interactive map to make an existing playground, the Magical Bridge playground [1] in Palo Alto, California, more accessible to visually impaired visitors. While this inclusive playground was specifically "created to be highly accessible to all visitors and to remove the physical and social barriers of today's typical playgrounds and give everyone a place to play," it is still challenging for visually impaired visitors to navigate independently.
The purpose of the interactive 3D map, which is planned as a permanent installation at the playground site, is to help visitors acquaint themselves with the layout of the playground and its many play features. Cross-modal delivery of haptic, visual and auditory information will help visitors of all abilities learn about the playground and feel more comfortable exploring and playing in it. The lessons we learn from designing, developing and testing the map for this specific playground will also inform the development of interactive installations for other environments, such as museums, parks and other playgrounds.
BACKGROUND AND RELATED WORK
Tactile graphics are an essential means of conveying spatial information to people with visual impairments, with standards detailing the best practices for how they should be designed [2]. As useful as they are, however, they have important limitations. A survey conducted on 27 blind tactile graphic readers and tactile graphic transcribers highlighted a number of problems with tactile graphics, with the top problem being a lack of availability [3]. Other problems included users not understanding the graphics, no standardization of symbolic content, low tactile graphic literacy among the readers, and the conflict between the need for simpler, more comprehendible graphics and the desire for more information about them.
In the last several years, studies such as [4] have found 3D models, mostly created through 3D printing, do not pose as many issues to readers as raised line tactile graphics. Studies such as [5] directly compared 3D models to tactile graphics and found that 3D models were preferred, were easier to remember, allowed for more variables to be represented, and allowed for easier to understand icons. These findings suggest that 3D models should be used whenever possible, especially for students with little to no experience with tactile graphics.
The current practice for labeling 3D maps and graphics is to use braille, either through sticky labels or by brailling on the graphic itself [2]. However, interactive graphics with digital labels have been found to be just as effective, faster, preferred by blind users, and more functional than braille labels [6]. Adding braille labels gets difficult when long labels or a large number of labels are needed, which may require abbreviating labels (e.g., "DS" for Diamond Street) on the graphic and using a separate set of pages as a key [2]. Needing to frequently switch between the graphic and key is disruptive to the map reading process and limited information can be stored on a key.
By contrast, one of the major advantages of interactive maps is that they do not require knowledge of braille to be effective [7]. Interactivity has been added to tactile graphics and 3D models in multiple ways including buttons, capacitive sensors, touchscreens, computer vision with hand tracking or markers, and QR codes. A commercially available product that facilitates the creation and use of interactive tactile graphics is the Talking Tactile Tablet [8], in which a tactile graphic is placed directly on the surface of a touch-sensitive tablet, and touching the tactile graphic at a specific location triggers the sound associated with that location. The PenFriend [9] stylus uses small barcodes affixed to an object to define audio labels. Computer vision approaches to audio labeling include [10], which focuses on 3D printed objects, [11], which uses a depth camera to access flat documents, and [12,13], which provide access to flat tactile graphics. For our current study we use the CamIO system [14] to provide audio labeling, which we describe in our Methods section.
METHODS
3D Map
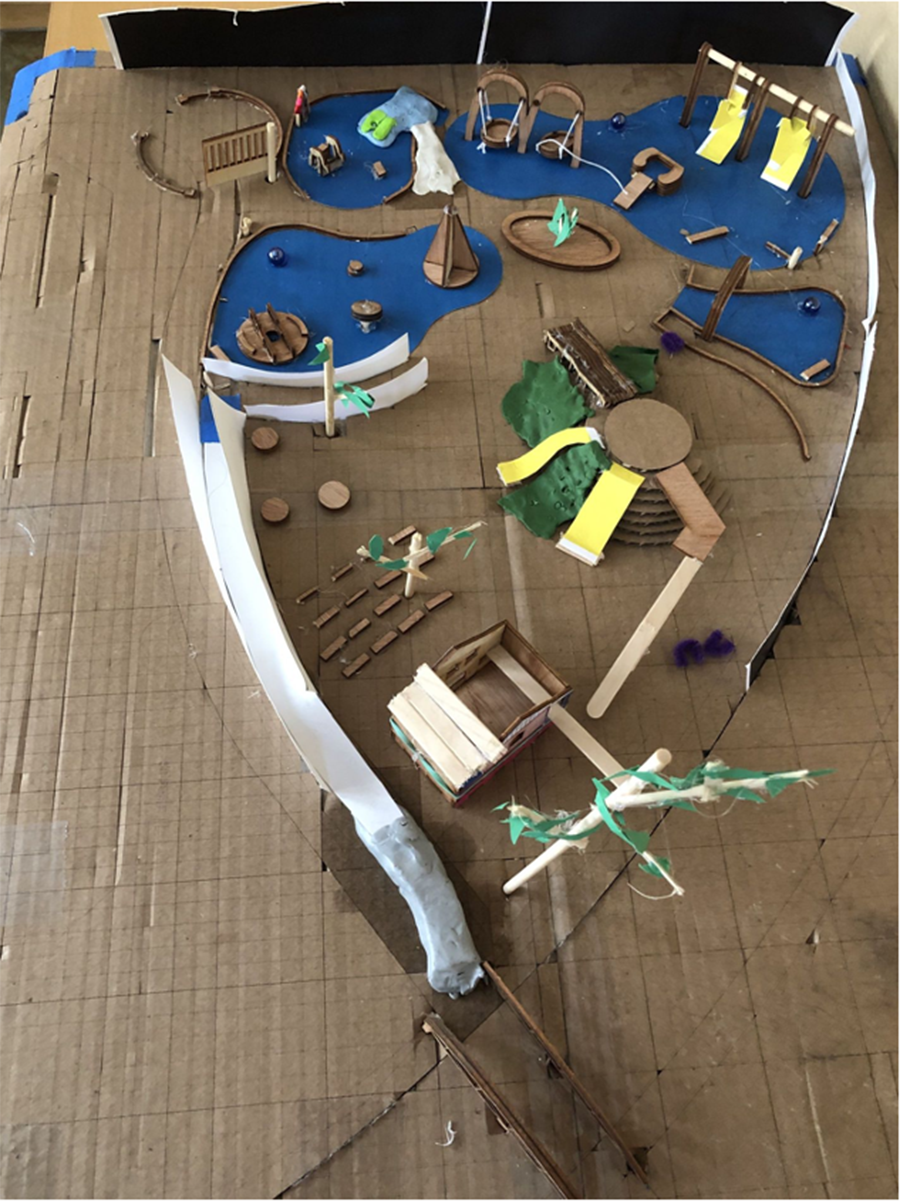
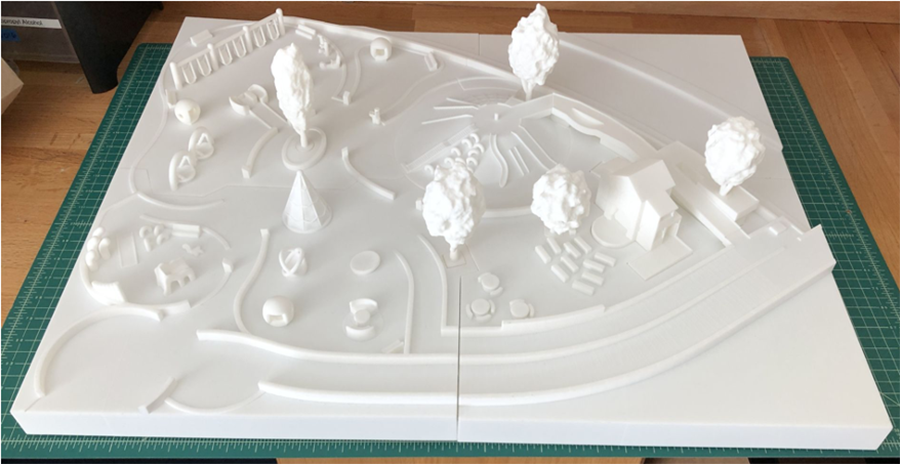
The 3D map (Fig. 1) was a 1:100 scale model of the Magical Bridge playground in Palo Alto that consisted of laser-cut wood and clay models on a cardboard-covered foam board. The map measured 76 cm by 62 cm; one centimeter on the model represents one meter on the actual playground. Several of the models, such as the swings, were fully functional, so participants could explore exactly how the object worked if they wished. One object, which resembled a large marble, was actually represented by a marble to show both the shape and texture of the object. The use of 3D printing was not investigated in this study because of the difficulty for rapid prototyping and the difficulty the blind designer (a co-author of this paper) had with creating CAD models. Since the study was conducted, however, we have used 3D modeling to construct a 3D-printed scale model (Fig. 2).
Interactive System
The interactive system used CamIO, a computer vision augmented reality system for annotating physical objects [14]. It provides real-time audio feedback in response to the location on an object that the user is pointing to. In this study, CamIO ran on a laptop computer connected to a webcam, which is fixed on a tripod with the webcam capturing the entire 3D map. (Since this study was conducted, CamIO has been developed as a self-contained iOS app using the built-in device camera.) The user holds an inexpensive stylus covered with barcodes, which allows the 3D location of its tip to be estimated so that CamIO knows which part of the 3D map is being pointed to.
A pre-defined annotation file specifies the 3D coordinates of various hotspots, i.e., points of interest on the object, along with the corresponding audio label that is issued when the stylus points to the hotspot. For the current study, the annotation file was created to associate audio-looped sounds of the different playground objects. For example, a slide was represented by a recording of someone going down a metal slide. This meant that as the stylus moved around the map, one could hear the sounds of the objects that were around the stylus, as if the participant was actually walking around a busy playground.
Participants
Seven blind and low vision participants were recruited from the Magical Bridge and other local volunteer communities. They ranged from 9 to 79 years old (4 female, 3 male). None of the participants were extremely familiar with the layout of the playground, although five of the participants had been to Magical Bridge before.
RESULTS
Finding Objects on the Map
Participants were first presented with the stylus and shown the map. They were then told to touch the stylus to an object to hear its name. (If the system incorrectly failed to play aloud an audio label, it was instead read aloud by a person assisting in the experiment.) Then they were asked to find different objects on the map, such as a swing or slide. The average time to find an object was 1.17 minutes. The participants were asked to find three objects, and the average times were 1.45 minutes for the first object, 1.5 minutes for the second object and 0.58 minutes for the third object. The longest it took someone to find an object was 4.75 minutes. This was because the blind participant circled the map several times, missing the object which was on the perimeter. Typically, participants used one hand to feel objects and the other hand to hold the stylus and touch the stylus to objects after the first hand felt them. None of the participants explored the prototype without the stylus and all the participants made extensive use of the labels, touching a new label every three or four seconds. One of the participants wanted something that could trace the route on the map from his current location to the object he was looking for.
The NASA task load index (NASA TLX) [15] was used to evaluate how difficult each participant found it to complete tasks with the map. This is a tool for measuring subjective mental workload, using a scale of 0-100, where 0 is minimum effort and 100 is maximum effort. For finding objects on the map, only one person had the overall average task load score slightly above 50. The average overall task load score for all seven participants together was 38.9 with a mode of 40.2, a max of 54.2 and a min of 24.2. One of the participants wanted the play zones of the playground more clearly marked so they could group the objects together more easily. Another participant found the system very easy because they were able to match the incomplete mental model they had of the playground with what they were seeing on the prototype. The two participants with an overall average task load score less than 26 explicitly mentioned that the map was fun and repeatedly described using the map as easy. Two of the other participants expressed frustration that they didn't systematically memorize the map at the beginning of their exploration. Two of the participants felt they spent a long time finding objects, one thought finding objects was fine, and the other did not like wandering around the map.
Physically Navigating to Objects
The next part of the study explored how participants might physically navigate to an object in the actual playground after feeling the corresponding route to it on the map. Three participants felt comfortable physically navigating to an object in the playground, two gave feedback on why they were not yet comfortable, one said no, and the other didn't think they could navigate around the playground very well in their wheelchair. Comments from the participants who declined to navigate centered around needing more time and assistance with memorizing the route, and include: "having something that would tell me what direction the bucket swing is from my location here" and "It would take me a good part of the afternoon because I'm still so new at this."
Of the three participants who navigated to the object, two were low vision and one was completely blind, although everyone touched the map to memorize the route. It took the low vision participants 0.15 minutes and 1.42 minutes to memorize the route and the blind participant 3.45 minutes to memorize the route. What took the longest time was participants needing to find the object on the map they were finding the route for. Once they found the object, then two of them traced with their hand the route they were planning to walk between the objects.
Finding the object took the two low vision users 0.75 minutes and 2.48 minutes and the blind user 5.7 minutes. During the walk, all the participants queried the researcher about features in their environment. One of the low vision users asked if a concrete strip was a path and they were told that no, it was a curb with plants in it. The blind participant asked for descriptions and names of objects as she hit them with her cane. She also asked for a scan of the area to find out the objects nearby at the time. Two of the participants, one low vision and the blind participant, got lost where the path needed to go around a large planter. The blind participant asked what direction the object was from them as they circumnavigated the planter. The fastest navigator commented that the textures of the ground were extremely helpful in finding their way.
Navigational Goals When Entering the Playground
Four participants said they wanted a sighted person to take them around the playground initially to get them oriented. One participant wanted to show their sighted granddaughter around the playground and point out objects she could interact with. Two of the participants were worried about hurting other kids who were not paying attention while walking through the playground. The two participants with guide dogs were worried about keeping their dog safe both from running children and while they were interacting with the objects on the playground. Two participants wanted to know about ground textures their wheeled devices could traverse. One participant said after the playground was memorized, the map would no longer be useful.
Feedback on the Prototype
Five of the participants were asked what they liked, what needed to be improved, and what they didn't like about the prototype. All of the participants liked the 3D model and the fact the texture of the models often matched the textures of the real objects. "I like the 3 dimensionality, from some of the objects, I could tell what they were without needing any labels… It was really cool that the texture on the map matched the texture in real life… I was able to picture the objects around me as I was walking through them and that was very helpful." Another participant said they liked the audio sounds along with the tactile models: "I was seeing things spatially, tactilely, and auditorily".
In general, the participants expressed they wanted more details in the map. Three participants explicitly mentioned they wanted more textures and pathways. When navigating, one of the participants found the textures extremely important for finding their way and they wanted to see those textures reflected on the map. Another participant had a walker that could only go on particular surfaces, so he needed a way to plan out what surfaces he could go on. Two of the participants got stuck, when navigating, on a feature that was not clear on the map. On the map it looked like one could walk through an area that was not walkable, so the detail needed to be as high as possible so participants could plan effectively. One of the participants detailed a system that would show routes between objects. He wanted a miniature robot that would guide him from point A to point B, taking the fastest route.
When asked what they didn't like about the prototype, three of the participants couldn't think of anything. The other two participants expressed they wanted the audio labels to be more accurate, only triggering when they touched the object, rather than triggering a centimeter away from the object. One participant didn't realize there was an object a centimeter away from her finger when she touched the stylus to the map. They also wanted one label to play at a time and they found the map to be too general with not enough details like paths and textures.
DISCUSSION AND CONCLUSION
This study investigated the effectiveness of an interactive map made out of 3D models. In general, participants liked the interactive 3D map and how they were able to connect the textures and shapes of the models with their life-sized counterparts. There were two problems with the map: First, it took participants an average of 1.17 minutes to find an object on the map, which is too long. Second, there was not enough detail for pathways and ground textures for participants with wheeled devices to effectively plan their routes, and the map only showed large objects without indicating where it was possible to walk.
After conducting this study, we have addressed these issues in two main ways. First, we have developed a CamIO user interface that provides explicit verbal guidance to a desired hotspot [16]. We have also improved the pointing accuracy of the stylus to minimize errors in audio announcements. Second, we have designed an extremely detailed 3D digital model of the playground based on blueprints and extensive photos of the playground. This new model, which was 3D printed as a 1:100 scale plastic model (Fig. 2), has more realistic objects and obstacles, such as climbing structures, walls and trees. We are planning to add textural cues to indicate paths where people can walk (smooth textures for paths and rougher textures for grass and dirt) in future versions of the map.
We will perform user studies with the new map when the pandemic restrictions are lifted, and the results of these studies will inform our plans to create a bronze version of the 3D map planned for permanent installation at the playground. Ultimately the 3D map will be deployed in conjunction with an accurate turn-by-turn smartphone navigation tool to help users navigate the playground. Finally, our study highlights the need for long-term research into technologies such as dynamic VR and holographic tactile displays that enable truly seamless and effortless navigation experiences.
REFERENCES
- (2021, March 12). Magical Bridge Foundation. https://magicalbridge.org/
- (2021, March 12). Guidelines and Standards for Tactile Graphics. Braille Authority of North America. http://www.brailleauthority.org/tg/
- Rowell, J. and Ongar, S. (2003). The world of touch: An international survey of tactile maps. Part 2: Design. British Journal of Visual Impairment. 21, 3 (2003), 105–110.
- Jafri, R., & Ali, S. A. (2015, July). Utilizing 3D printing to assist the blind. In 2015 International Conference on Health Informatics and Medical Systems (HIMS'15) (Las Vegas, Nevada, 2015) (pp. 55-61).
- Holloway, L., Marriott, K., & Butler, M. (2018, April). Accessible maps for the blind: Comparing 3D printed models with tactile graphics. Proc. 2018 CHI conference on human factors in computing systems (pp. 1-13).
- Brock, A. M., Truillet, P., Oriola, B., Picard, D., & Jouffrais, C. (2015). Interactivity improves usability of geographic maps for visually impaired people. Human–Computer Interaction, 30(2), 156-194.
- Brock, A., & Jouffrais, C. (2015). Interactive audio-tactile maps for visually impaired people. ACM SIGACCESS Accessibility and Computing, (113), 3-12.
- (2021, March 12). Talking Tactile Tablet. Touch Graphics. http://touchgraphics.com/portfolio/ttt/
- (2021, March 12) PenFriend and Touch Memo: A Comparison of Labeling Tools. AccessWorld. https://www.afb.org/aw/12/9/15900
- Shi, L., Zhao, Y., & Azenkot, S. (2017, October). Markit and Talkit: a low-barrier toolkit to augment 3D printed models with audio annotations. ACM Symposium on User Interface Software & Technology (pp. 493-506).
- Thevin, L., & Brock, A. M. (2018, July). Augmented reality for people with visual impairments: designing and creating audio-tactile content from existing objects. Int'l Conf.on Computers Helping People with Special Needs.
- Fusco, G., & Morash, V. S. (2015, October). The tactile graphics helper: providing audio clarification for tactile graphics using machine vision. 17th Int'l ACM SIGACCESS Conference on Computers & Accessibility.
- (2021, March 12). Tactile Images READER. Apple App Store. https://apps.apple.com/gb/app/tactile-images-reader/id1493969253
- Coughlan, J. M., Shen, H., & Biggs, B. (2020). Towards accessible audio labeling of 3D objects. In Journal on technology and persons with disabilities. (Vol. 8, p. 210).
- Hart, S. G. (2006, October). NASA-task load index (NASA-TLX); 20 years later. Proc. human factors and ergonomics society annual meeting (Vol. 50, No. 9, pp. 904-908). Los Angeles, CA: Sage publications.
- Coughlan, J. M., Biggs, B., Rivière, M. A., & Shen, H. (2020, September). An Audio-Based 3D Spatial Guidance AR System for Blind Users. Int'l Conf. on Computers Helping People with Special Needs (pp. 475-484).
ACKNOWLEDGMENTS
Mr. Biggs and Dr. Coughlan received funding from NIH grant 5R01EY025332 and NIDILRR grant 90RE5024-01-00. Mr. Biggs also received funding from NIH grant 3R01EY029033-02S1. The authors would like to thank the Magical Bridge Foundation for helping with the study and funding the development of the 3D printed map.