Leighanne M. Jarvis![]() 1
1![]() , Sarah A. Moninger
, Sarah A. Moninger![]() 4
4![]() , Kevin M. Caves
, Kevin M. Caves![]() 1,2,3
1,2,3![]()
![]() 1
1![]() Department of Head and Neck Surgery & Communication Sciences, Duke University (Durham, NC),
Department of Head and Neck Surgery & Communication Sciences, Duke University (Durham, NC), ![]() 2
2![]() Department of Medicine, Duke University,
Department of Medicine, Duke University, ![]() 3
3![]() Department of Biomedical Engineering, Duke University, 4Duke Office of Clinical Research (Durham, NC)
Department of Biomedical Engineering, Duke University, 4Duke Office of Clinical Research (Durham, NC)
ABSTRACT
Changes in sleep and activity can cause sleep-wake disturbances which can contribute to an overall decline in health. There are interventions designed to help people correct these disturbances, but they require accurate documentation of active and inactive periods of activity that rely on self-report which has been shown to be unreliable. Activity tracking devices can reliably track activity, but these devices do not work well for low-intensity activity behaviors (e.g., reading, doing puzzles, sewing) and cannot provide environmental or social context to activity identification. This paper describes the development of a custom solution designed to trigger real-time surveys based on a user's activity level in an effort to facilitate collection of accurate real-time information on sleep-activity patterns. While this technology can be used in a variety of populations, older adults are the primary target due to their unique sleep-activity needs and changing activity behaviors.
INTRODUCTION
Sleep cycle disturbances are very common in the older adult population. Sleep problems and insomnia can contribute to worsening of pain, depression and other chronic conditions that can impact wellness and functional abilities. People with disability and chronic conditions are especially vulnerable to these risks. Additionally, loss of functional independence is a primary influencing factor in nursing home placement. [1] Research supports that positive sleep-wake behaviors (e.g., sedentary / physical activity and sleep) contributes to functional capacity and health in older adults. [2] Researchers studying sleep problems in a population of people with multiple Sclerosis (MS) found that people with poor reported sleep have significantly lower quality of life scores. [3]
There are established therapies for addressing sleep cycle disturbances. These interventions begin with documentation of the problem, typically using self-report, paper sleep diaries. Some studies have paired sleep diaries with activity monitoring to address some of the limitations of self-report instruments. In a study of 60 older veterans participating in an adult day health care setting, researchers reported that completing sleep diaries was challenging for people with functional or cognitive limitations. [4]
While there are a variety of commodity devices available to track activity such as smart watches (e.g., Apple / Samsung) and activity trackers (e.g., Fitbit), these devices are designed to measure activity levels or physical activity exercises (e.g., running, biking, swimming) primarily in a younger, healthier population. These devices are not able to delineate between types of sedentary behaviors or low-activity behaviors (e.g., light gardening, washing dishes). Research grade devices such as the ActiGraph and activPAL devices proport to be able to identify low-activity and sedentary behaviors [5] but do not have the ability to link to sleep diaries. Additionally, these platforms do not offer environmental or social context to activities that may be beneficial data for clinical populations. This is an important topic when considering "active behavior" for older adults and some people with disabilities may look very different than active behavior for other subsets of the general population.
Due to the confounding effects of sleep-awake patterns in older adults, we set out to create a platform that looks for periods of inactivity to identify potential daytime napping / drowsiness to help clinicians and users better understand why they may be having a poor night's sleep. In its current iteration, this platform works to identify sedentary and active behavior and prompt a user to answer surveys with questions related to pain, fatigue, physical and social surroundings, and current type(s) of activity / inactivity. The goal of this work is to develop a proof-of-concept tool that could be used to facilitate collection of daytime activity diaries by triggering real-time surveys based on periods of inactivity. This paper describes the development of the technology behind the platform as well as alpha testing.
APPROACH
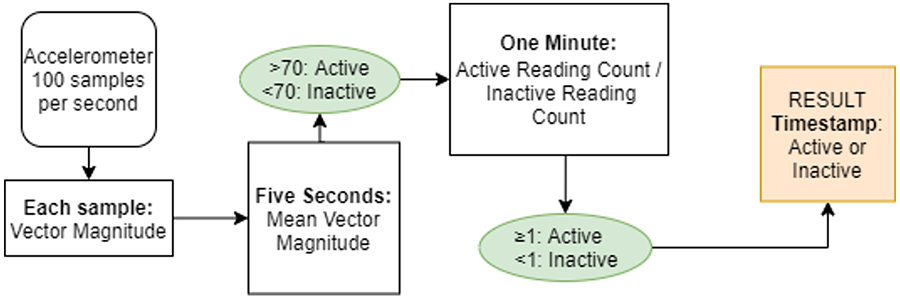
This platform utilizes both an Apple Watch (Model MWV82LL/A, WatchOS version 6.2.6), to track and compute activity data via the built-in accelerometer, and an iPhone (Model MQ722LL/A, iOS version 14.1) to allow subjects to provide real-time input to surveys when prompted. The custom watch app was written using Xcode / Swift to enable 3-axis accelerometer data sampled at 100 Hz, to be collected from an Apple watch worn on the wrist. A resultant magnitude vector was used in data processing and can be calculated for the 3-axis data. Data is streamed continuously and temporarily stored on the watch with the algorithm determining every five seconds if that period is active or inactive. The algorithm then classifies the previous 60 seconds of recordings as active if there are more active readings than inactive readings. This classification, the resultant magnitude, and timestamp are then saved to a file on the watch. These readings are then used to determine if the person is in an active or inactive period.
Computation of the acceleration vector magnitudes takes place on the watch to reduce the amount of data that needs to be sent to the phone which would increase storage and battery requirements. Additionally, processing data on the watch means that data collection would not be interrupted should the subject walk away from the phone.
Accelerometer "cut points" were determined by measuring acceleration of several common sedentary activities identified in the Compendium of Physical Activity [6] rated at 1.5 METS or lower [7]. Examples include watching TV, reading, doing puzzles, and talking on the phone. The accelerometer in the Apple watch gives normalized values for acceleration, meaning that the effect of gravity is subtracted as the readings are made. As a result, our acceleration readings were very small, so they are multiplied by 1000 to facilitate human reading. We established a target magnitude called the Activity Sensitivity (AS) of 0.07 g (or 70 g/1000) below which activity would be classified as inactive. This value was determined from pilot testing data collected during the development of the platform.
Watch Algorithm
Apple watch has a variety of built-in sensors including the tri-axial accelerometer which is exclusively used for this application. The accelerometer streams at 100 readings per second (100 Hz) and enables data capture in the x, y, and z watch orientation. The custom app calculates a vector magnitude from each x, y, and z reading, where v is the magnitude of the change in position every 100th of a second (Equation 1).
Equation 1. Vector magnitude equation from tri-axial accelerometer.
As described above, data is streamed continuously and stored locally every five seconds. The algorithm determines the median vector magnitude of the past 5 seconds of samples, storing this value and discarding the rest. If this reading is greater than or equal to the AS, the previous five seconds of readings are classified as 'active', and if less than the AS, the last five seconds are designated as 'inactive' or sedentary.
Twelve vector magnitude values are calculated and stored during each 60 second period. The algorithm then counts the active readings and the inactive readings. If there are 6 or more active readings across the previous 60 seconds, the full minute is designated as active, otherwise it is designated as inactive. This approach allows for some active readings to occur during an otherwise sedentary period without changing the classification, for example, allowing for some small arm motion (e.g., turning pages of a book, taking a drink, or working a puzzle) during a sedentary period. This minute designation is then timestamped and saved to file on the watch.
Table 1 summarizes the terminology used in this section and the user-customizable settings. If a period of inactivity exceeds the Minimum Period Length, the period is classified inactive, and a survey will be generated.
| Variable Name | Range | Description |
|---|---|---|
Minimum Period Length |
15 - 60 (min) |
Minimum period of inactivity considered inactive. Default is 30 min but must be less than Maximum Period Length. |
Maximum Period Length |
30 - 90 (min) |
Period of inactivity that will close a period and automatically trigger a survey. Default value is 60 min. |
Five-Minute Proportion |
0.1 - 1.0 |
This proportion looks at the previous five minutes and determines if there has been enough activity to warrant stopping any ongoing inactive periods. |
Activity Sensitivity |
0 - 150 (g/1000) |
Cut point value used to determine if a period is active or inactive. Default value is 70 g/1000. |
Inactivity Period Proportion |
0.1 - 1.0 |
This proportion allows for some active readings to fall within an inactive period (e.g., taking a restroom break) without stopping the ongoing inactive period. |
For a period to be determined inactive and a survey to be generated, the following conditions must be met: 1) there must be more magnitude vectors recorded below the AS cut point; 2) there must be fewer active than inactive readings in the previous 5 minutes than the Five-Minute Proportion; 3) the number of active readings must be less than the Inactivity Period Proportion specified; 4) there must be more inactive recordings than the Minimum Period Length; 5) there are not 4 consecutive minutes of recordings classified as active. If any of these conditions are not met, the ongoing open periods are closed, after which the watch sends the file of minute-readings to the companion app on the phone via Bluetooth File Transfer. Figure 1 summarizes the inactivity / activity determinant algorithm in a flow chart (Figure 1).
Phone Algorithm
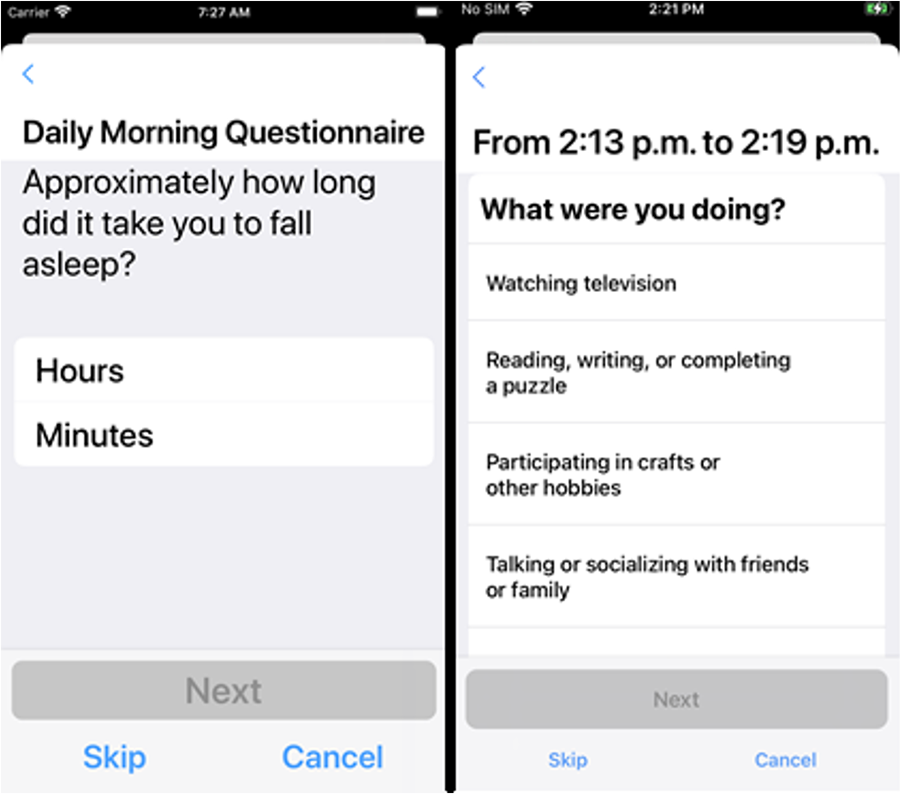
The companion app on the iPhone / iPad is used to present the participant with the surveys generated by their daily activities. If inactivity periods have been recorded, the app shows a list of surveys the participant is prompted to answer. These surveys are presented with HealthKit, an open-source framework designed to collect medical research. The surveys are displayed to the subjects at the end of periods of inactivity and contain questions about what they were doing during the inactivity period (Figure 2). The surveys were developed in consultation with a sleep psychologist, based on typical paper sleep diaries and ask questions about the inactive period such as what the subject was doing, where they were, who was with them. The app also presents the user with a morning sleep quality survey and evening daytime wellness survey, delivered at the same time each day (Figure 2). In addition to giving the user an interface to answer survey responses, the phone app parses the saved data into JSON files, which can be sent via email for further data analysis. Notifications of available surveys are sent to both the watch and the phone.
RESULTS
To date, the platform has been alpha tested with researchers and clinicians working on the project to test usability as well as accuracy in data collection and processing. A full research study with older adults is actively underway and will be reported on in subsequent publications. Preliminary research shows that the platform is acceptable, accurate and able to identify active and sedentary behaviors in in the target population. Most promising, the use of surveys delivered in response to sensor data has been well received opening the door for future use of real-time surveys to help motivate and collect time dependent data on activity, drowsiness, and other daily life factors.
DISCUSSION
Although the development team created custom software to collect and analyze data, there were some limitations and challenges associated with using commodity hardware. Specifically, the iOS and WatchOS platforms prohibits running tasks in the background of both the phone and the watch. Apple requires most watch apps to utilize resources only when they are being interacted with by the watch owner. Background tasks must be sporadic and are subject to the operating system killing them if they last too long. While this limitation is designed to protect the user and save battery life, it also means we had to develop "work arounds" to enable constant data collection while giving the user the ability to continue using their phone / watch. While normal use of a phone and watch during pilot testing is not necessary, for long-term use and future studies, users need the ability to use their smart devices as intended.
One iOS framework not subject to this rule supports exercise / workouts (e.g., an app that can track runs or hikes to count steps and calorie expenditure). A workout session is permitted to run in the background of the watch, because it is assumed the app will end the session when the user stops their activity. The app used in this study worked off this exception by streaming accelerometer data through the workout session framework. While this was technically feasible, a 24-hour plus workout does not fit within Apple's guidelines for workout background capabilities, making it almost certain that the Apple app review process would deny publishing on the App Store. For purposes of future studies and work centered around this platform, this is not an immediate issue considering there are other ways to deliver the app to research subjects. In the event this platform does reach maturity and has the capability to be used outside of a research study, the development team will likely need to utilize a different hardware platform for delivery.
While not thoroughly discussed as part of this paper, in addition to sensor-based prompts from representative vector magnitude readings, the platform also enables daily prompts sent to the user in the morning and evening to gather information on sleep hygiene (morning) and daily activity (evening). These surveys will further allow clinicians and researchers the ability to monitor sleep-wake behaviors and make recommendations based on results to help the population have a healthier lifestyle and ultimately improve or maintain ability to do activities of daily living.
A study is currently underway to evaluate the usability, acceptance, and accuracy of the technology platform with older adults. This study will help inform future development on the platform and enable analysis on accuracy of the technology as it stands within the population. Initial testing during development shows potential for its use within older adult populations.
FURTHER IMPLICATIONS
This work is important because as technologies are increasingly used with older adults and other specialized populations, developers need to incorporate collection modalities that work within that population. Specifically, for this work, we needed a way to characterize light activity (e.g., light housework) to identify when someone in the population may be active. Additionally, future validation studies may show the acceptance of real-time surveys to capture data from older adults and eventually help to decrease daytime inactivity.
REFERENCES
- Gaugler JE, Duval S, Anderson KA, Kane RL. Predicting nursing home admission in the U.S.: a meta-analysis. BMC Geriatr. 2007 7(13).
- Smith K, Rosenberger M. Keeping seniors active: A 24-hour approach. Stanford, CA: Stanford Center on Longevity. 2017.
- Lobentanz IS, Asenbaum S, Vass K, Sauter C, Klösch G, Kollegger H, Kristoferitsch W, Zeitlhofer J. Factors influencing quality of life in multiple sclerosis patients: disability, depressive mood, fatigue and sleep quality. Acta Neurologica Scandinavica. 2004 110(1):6-13.
- Hughes JM, Song Y, Fung CH, Dzierzewski JM, Mitchell MN, Jouldjian S, Josephson KR, Alessi CA, Martin JL. Measuring sleep in vulnerable older adults: a comparison of subjective and objective sleep measures. Clinical Gerontol. 2018 41(2):145-157.
- Byrom B, Stratton G, Mc Carthy M, Muehlhausen W. Objective measurement of sedentary behaviour using accelerometers. Int J Obes. 2016 40(11):1809-1812.
- Ainsworth BE, Haskell WL, Leon AS, Jacobs Jr DR, Montoye HJ, Sallis JF, Paffenbarger Jr RS. Compendium of physical activities: classification of energy costs of human physical activities. Med Sci Sports Exerc. 1993 25(1):71-80.
- Ainsworth BE, Haskell WL, Herrmann SD, Meckes N, Bassett Jr DR, Tudor-Locke C, Greer JL, Vezina J, Whitt-Glover MC, Leon AS. The Compendium of Physical Activities Tracking Guide. Healthy Lifestyles Research Center, College of Nursing & Health Innovation, Arizona State University. Retrieved March 10, 2021 from https://sites.google.com/site/compendiumofphysicalactivities/.
ACKNOWLEDGEMENTS
This work is supported by the Duke Claude D. Pepper Older Americans Independence Center which is supported by the National Institute on Aging at the National Institutes of Health, grant number P30AG028716.