Marc Sebastián-Romagosa![]() 1
1![]() , Woosang Cho
, Woosang Cho![]() 2
2![]() , Rupert Ortner
, Rupert Ortner![]() 1
1![]() , Katrin Mayr
, Katrin Mayr![]() 2
2![]() , Christoph Guger
, Christoph Guger![]() 1,2
1,2![]()
![]() 1
1![]() g.tec medical engineering Spain SL (Barcelona, Spain),
g.tec medical engineering Spain SL (Barcelona, Spain), ![]() 2
2![]() g.tec medical engineering GmbH (Schiedlberg, Austria)
g.tec medical engineering GmbH (Schiedlberg, Austria)
INTRODUCTION
Stroke is the second largest cause of death worldwide. Stroke survivors usually suffers severe motor and sensory impairment that hinder the activities of daily living. The functional deficit of lower limb is the most common paresis after stroke. It is not common for the stroke patients to fully recovery after months and years of the treatments and therapies, which leaves them in some degrees of impairment. Many of them do not reach a walking level to perform all their daily activities [1, 2]. Gait recovery is one of the major therapy goals in the rehabilitation program for stroke patients and methods for gait analysis and rehabilitation has been developed [2]. The weakened muscle tone also becomes an obstacle in motor rehabilitation. Therapies such as active foot drop exercise, electromechanical assisted therapy and treadmill therapy are usually limited to the patients with mild or moderate impairment [2]. Functional electrical stimulation (FES) has also been used in motor rehabilitation therapy over the last decades. It is known that passive FES therapy itself can reduce muscle spasm and shorten the term of motor recovery [3]. Passive therapies such as continuous passive motion or cycling therapy have been employed for the patients and showed the functional improvements in the previous studies [4]. However, they do not include or cannot monitor the patients' active engagement of the therapy.
Today, Brain-Computer Interface (BCI) technology can provide an objective tool for measuring Motor Imagery (MI), creating new possibilities for "closed-loop" feedback. The closed-loop feedback, that is linked with the desired mental activity, is important for every feedback system and made possible through MI-based BCI. It could significantly improve rehabilitation therapy outcomes of stroke patients [5].
Currently there are numerous articles that talk about rehabilitation of the upper limb with BCI technology, but the rehabilitation of the lower limb is completely new. The objective of this study was to analyze the effectiveness of BCI therapy in the functional rehabilitation of lower extremity in stroke survivors.
Methods
Participants
For this preliminary study 2 males and 1 female were included. The mean age of the participants was 59 (±4.3) years and they all were in a chronic stage with time since the stroke 13 (±17.3) years. Participant 1 (P1) was a female, 62 years old and time after stroke 33 years. Participant 2 (P2) and Participant 3 (P3) were males, 61 and 54 years old with time after stroke 4 and 2 years. No previous BCI training was performed with the subjects, the three participants were BCI naive.
The following inclusion criteria was applied: 1) residual hemiparesis in his/her lower limb, 2) the stroke occurred at least four days before the first assessment, 3) functional restriction of the lower extremities, which prevent the persons from activities of everyday life, 4) ability to perform 10 Meter Walk Test. Additionally, 6) able to understand written and spoken instructions, 7) stable neurological status, 8) willing to participate in the study and to understand and sign the informed consent, 9) able to attend meetings. Patients with 1) active or passive implanted medical devices such as pacemakers which do not allow the use of FES, 2) implanted metallic fragments in the extremities which can limit the use of FES, 3) cerebellar lesions, 4) multiple stroke history, 5) elevated intracranial pressure, 6) pronounced hemi-neglect, 7) history of disordered aneurism, 8) history of epilepsy or seizures that is uncontrolled by proper treatment, 9) under the influence of anesthesia or similar medication, 10) significant circulatory disturbances of the lower limbs, 11) severe lung diseases, infections, renal insufficiency, liver damage, heart diseases, 12) sensory disorders which can significantly affect the patient's ability to feel pain and to react to unsuitable proprioceptive stimuli, 13) diseases of the peripheral nervous system affecting the upper limbs or 14) Botulinum toxin treatment of his/her paretic lower limb during this study were excluded from the study.
Study design
Each participant received 2 months of BCI training based on MI with FES and visual feedback. The BCI sessions were distributed in 3 times per week, 25 sessions in total. Each session lasted about 1 hour. Two functional assessments were performed before the therapy started (Pre1, one month before the therapy and Pre2, a few days before the therapy) and one more functional assessment was performed immediately after these 25 BCI sessions (Post1). The functional scales used in the assessment sessions are detailed in the next section.
Functional and Behavioral Assessments
The primary outcome measure was the 10 Meter Walk Test (10MWT) that assesses walking speed in meters per second over a short duration. Subject is instructed to walk in self-selected velocity (10MWTSS) and/or in fast velocity (10MWTFV) over the length of 10 meters. The time is measured between meter 2 and 8 to exclude the acceleration and deceleration speed. Secondary scores included Timed Up and Go Test (TUG) that is used to determine fall risk and measure the progress of balance, sit to stand and walking. Subject is sitting on a chair and is instructed to stand up, walk 3 meters, turn around, walk back to the chair and sit down again. The time is measured from the beginning until the end of the task [6]. These two scores are measured in time (minutes and seconds), where lower values represent lower level of impairment. Range of Motion (ROM) for active ankle dorsiflexion and flexion was also used to measure the movement ability of the affected ankle. The subject is in long sitting position with a pillow placed under his/her knee so that the hill is lifted off the surface. Goniometer is placed on the lateral malleolus with stationary arm is leaning up to the fibula head and movable arm is parallel to the longitudinal axis of the 5th metatarsal when the subject is asked to perform ankle dorsiflexion movement or/and ankle flexion movement [7]. The score is measured in degrees, where higher values are also linked to lower impairment.
BCI system description
Patients were seated in a comfortable chair in front of LCD screen sideways with a desk, where they placed the healthy arm and were able to see the paretic foot in front of them. EEG cap with 16 active electrodes (g.Nautilus PRO, g.tec medical engineering GmbH, Austria) was used with electrode positions according to the international 10/20 system at FC3, FCz, FC4, C5, C3, C1, Cz, C2, C4, C6, CP3, CP1, CPz, CP2, CP4 and Pz. A reference electrode was placed on the right earlobe and a ground electrode at FPz. One pair of FES pads was placed on the extensor digitorum communis (EDC) of the healthy hand to induce wrist dorsiflexion. The second pair was placed on tibialis anterior (TA) of the paretic foot to induce ankle dorsiflexion. The parameters of two FES devices (g.Estim FES, g.tec medical engineering GmbH, Austria) were set to a frequency of 50 Hz and a rectangular pulse width of 300 μs for the wrist and 400 μs for the ankle dorsiflexion. The stimulation amplitude (mA) was adjusted to find the optimal movement.
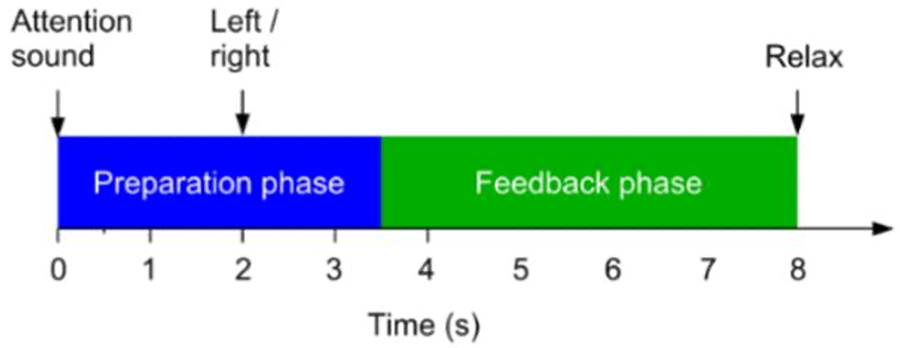
All participants were instructed to imagine the wrist or ankle dorsiflexion according to the system indications. One session was composed by 240 trials on both hand and foot. Figure 1 below describes the timing of each trial.
The MI tasks were presented in pseudo random order with randomized inter-trial intervals. During the feedback phase, FES and avatar was triggered when the system detected correct MI. If no MI is detected, feedback is deactivated. Feedback was updated five times per second.
Signal Processing
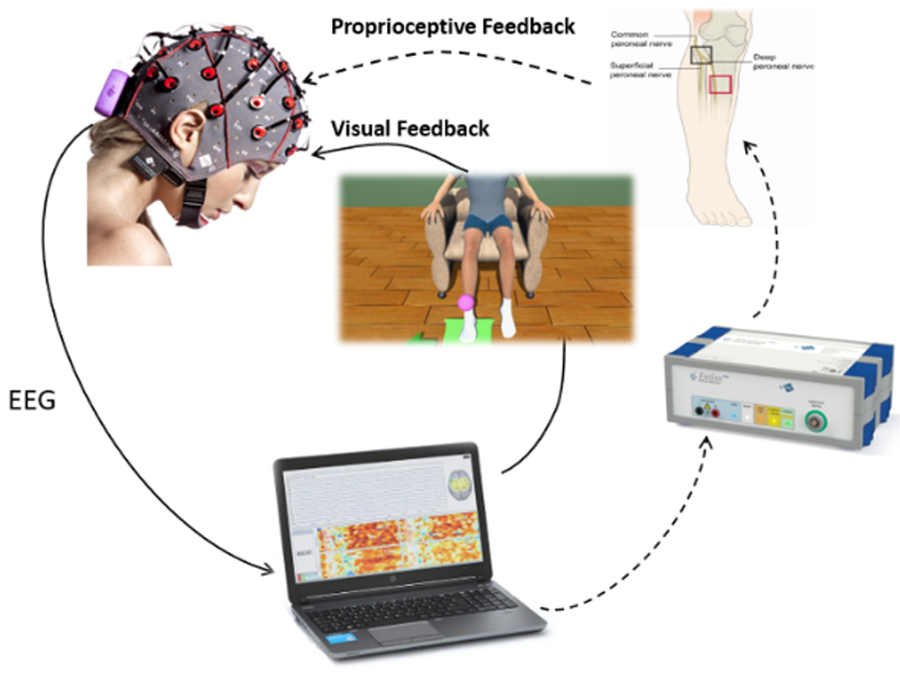
EEG signals were sent to a bio signal amplifier and were bandpass filtered with Butterworth filter 4th order, between 8 and 30 Hz. Then common spatial patterns (CSP) were applied to transform the data to a new matrix with minimal variance of one class and maximal variance of the other class. Each class reflects the MI of the cued hand versus the MI of the foot. A linear discriminant analysis (LDA) classified each trial as either left (hand or foot) or right (hand or foot) MI, depending on the side that is affected. When the input signals were correctly classified according to the assigned task, the feedback devices were triggered. Complete system can be seen on Figure 2.
Results
Functional improvement
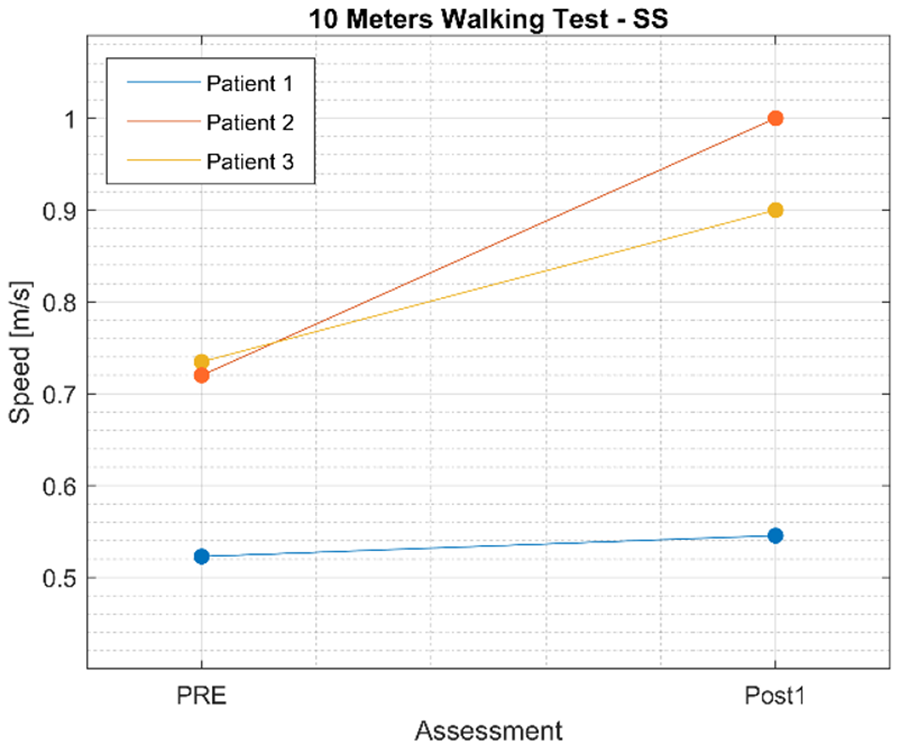
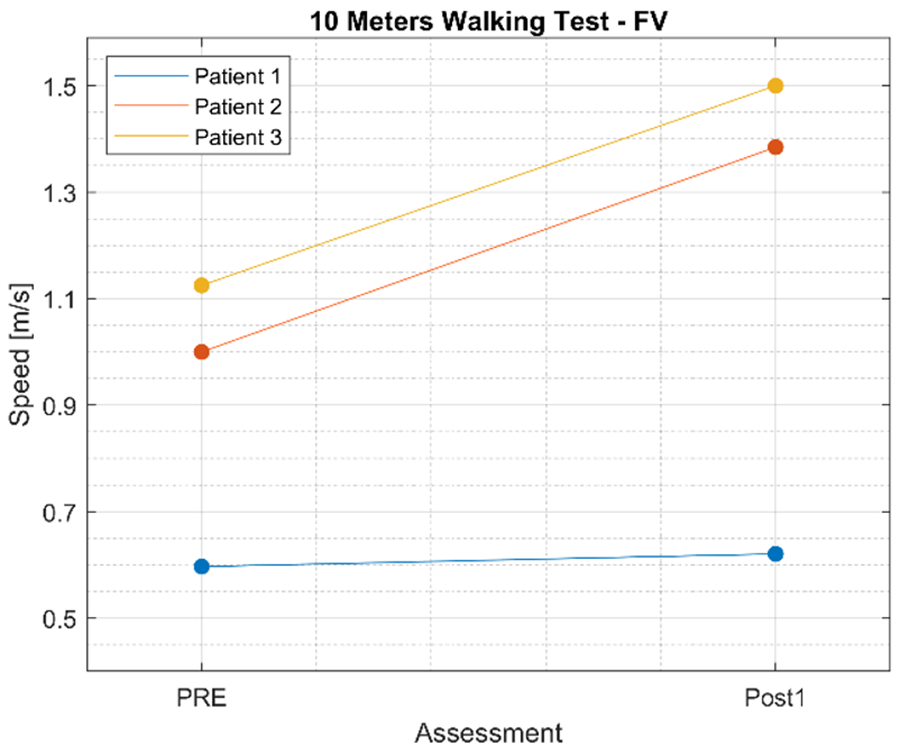
Results for 10MWT show that the walking speed for all participants increased. Figure 3 shows functional improvement in walking speed, that was measured with 10MWT for Self-Selected velocity (10MWTSS). Walking speed for P1 increased for 0.02 m/s, for P2 self-selected velocity increased for 0.28 m/s, and for 0.17 m/s for P3. Similar results can be observed also for 10MWTFV on Figure 4, where walking speed for fast velocity increased for P1 for 0.03 m/s, for P2 for 0.38 m/s, and for 0.37 m/s for P3.
Improvements in fall risk and measured of the progress for balance while being sited, standing up and walking measured with TUG were also observed. Score for TUG for P1 increased for 0.05 m/s, from 0.25 to 0.3 m/s, 0.1 m/s for P2, from 0.44 to 0.54 m/s and 0.18 m/s for P3, from 0.36 to 0.54 m/s. ROM for active dorsiflexion, that was the targeted movement of the BCI training also increased. Dorsiflexion of the P1 improved for 6.65°, from 3.65 to 10.3° and flexion for 2.7°, from 5.5 to 8.2°. P2 showed improvement in degrees of dorsiflexion for 9°, from 15.3 to 24.3°, but flexion reduced for 0.5°, from 8 to 7.5°. Similar results were observed for P3, where dorsiflexion increased for 20.4°, from 8.1 to 28.5°, and flexion decreased for 9°, from 8.2 to 7.3°.
BCI performance
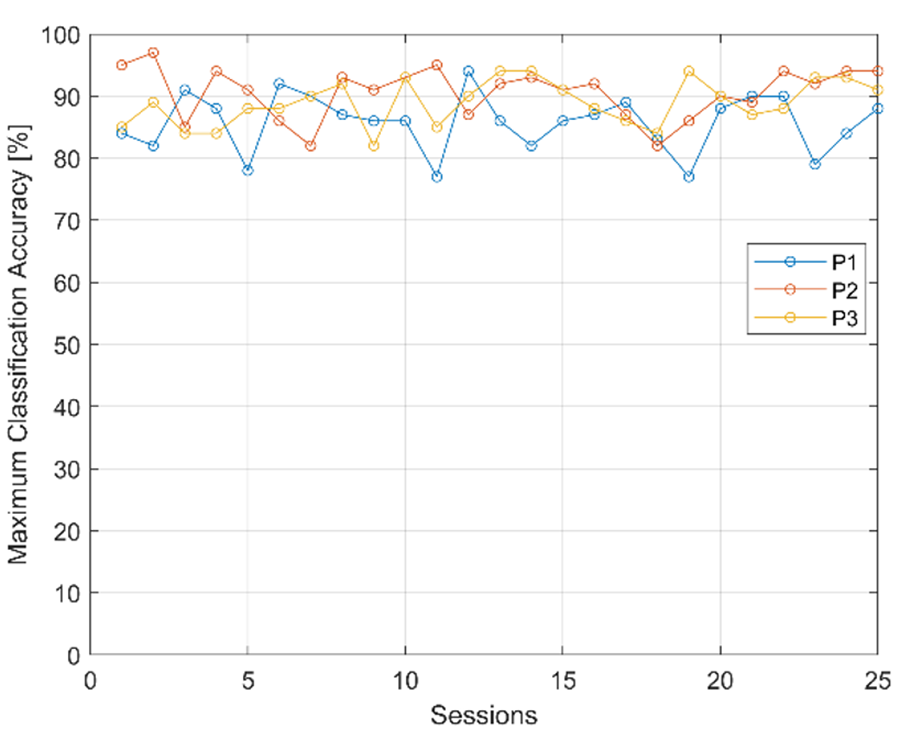
Maximum classification accuracy (MCA), that is the measure of BCI performance is presented on Figure 5. MCA of P1 was 84% in the session 1, and 88% in session 25. The average accuracy over 25 sessions for participant 1 was 85.8%. P2 had average MCA 90.6% with maximum accuracy reaching 97% in session 2. And P3 had 88.9% MCA average over 25 sessions with maximum accuracy 94% that was achieved in session 13, 14 and 19.
Discussion
The current study was conducted to test the effect of BCI based training with FES and avatar feedback for lower extremity after stroke on functional movement and gait. The results presented are from 3 participants and should be regarded accordingly. These preliminary results show that all 3 patients showed improved motor and gait performance after 2 months of BCI based rehabilitation training, which could demonstrate effectiveness of this rehabilitation technique. For the improvement of walking ability after stroke Electromechanical-assisted training with end-effector has been shown to be one of the most effective approaches compared to conventional therapy [2]. In the end-effector system the patient is secured by straps and stands on two footplates that simulate walking. Only feet that are fixed to the footplates are being moved by the device [1]. Rehabilitation effect for walking speed with end-effector rehabilitation techniques shows 0.16 m/s better results than rehabilitation with conventional therapy [2]. The results of our 3 participants show in average similar results for 10MWTSS, where the improvement is 0.16 m/s and 0.26 m/s faster walking speed for 10MWTFV. Considering that the preliminary results are from 3 participants only, we do not believe further group statistical analysis would be appropriate at this point, but the trend of rehabilitation effect is showing as promising. Improvement in walking speed of P1 was a lower compared to P2 and P3. When looking at the baseline of walking speed, results show her level of impairment is higher than from P2 and P3, which could have influenced the rehabilitation of gait and functional improvement as it is shown in similar studies [2]. Age of the subjects and time after stroke are factors that could influence the outcome of the rehabilitation. Learning and rehabilitation processes by itself are lower with greater age and time after. Our participants were of similar age, but the difference in time after stroke was great. P1 was 33 years after stroke, whereas P2 was 4 years after stroke, and P3 was 2 years after stroke. These results could suggest that the effectiveness of BCI based rehabilitation training becomes lower with higher time after stroke. Similar results were observed also for TUG, where P1 improved less then P2 and P3. Interestingly, both ROM dorsiflexion and flexion improved for P1, but flexion was slightly lower for P2 and P3. Ankle dorsiflexion is shown to have an influence on walking and functional movements of the foot and balance. Also, here, the baseline and degrees of improvement were slightly lower with P1 compared to P2 and P3. As mentioned previously, the level of impairment shown with lower ankle dorsiflexion baseline could have influenced the walking speed improvement. P3 shows the highest improvement in walking speed and ankle dorsiflexion movement when compared to P1 and P2. When looking at the MCA, all 3 participants showed relatively high classification accuracy, between 85 and 91%. Some of the previous studies using similar systems for upper extremity rehabilitation [5] showed that classification accuracy could influence the rehabilitation effect. Higher accuracy rates are connected with higher feedback rate. Higher accuracy rates are also showing participants motivation and investment in the therapy which could influence the rehabilitation outcomes of the patients after stroke that are using BCI based techniques. Another reason why brain activity and feedback coupling shows importance is, that it can improve Hebbian learning [8], which is critical to motor recovery after stroke.
Overall, the work presented here suggests that BCI based training can induce functional improvement and gait in persons with difficulties in walking resulting from a stroke. However, additional research including more patients is needed to demonstrate its effectiveness compared with conventional therapy and explore other avenues.
REFERENCES
- Hesse S, Mehrholz J, Werner C. Robot-Assisted Upper and Lower Limb Rehabilitation After Stroke. Dtsch Aerzteblatt Online [Internet]. 2008 May 2; Available from: https://www.aerzteblatt.de/10.3238/arztebl.2008.0330
- Mehrholz J, Thomas S, Werner C, Kugler J, Pohl M, Elsner B. Electromechanical-assisted training for walking after stroke. Cochrane Database Syst Rev [Internet]. 2017 May 10; Available from: http://doi.wiley.com/10.1002/14651858.CD006185.pub4
- Hong Z, Sui M, Zhuang Z, Liu H, Zheng X, Cai C, et al. Effectiveness of Neuromuscular Electrical Stimulation on Lower Limbs of Patients With Hemiplegia After Chronic Stroke: A Systematic Review. Arch Phys Med Rehabil [Internet]. 2018 May;99(5):1011-1022.e1. Available from: https://linkinghub.elsevier.com/retrieve/pii/S0003999318300169
- Ferrante S, Pedrocchi A, Ferrigno G, Molteni F. Cycling induced by functional electrical stimulation improves the muscular strength and the motor control of individuals with post-acute stroke. Europa Medicophysica-SIMFER 2007 Award Winner. Eur J Phys Rehabil Med [Internet]. 2008 Jun;44(2):159–67. Available from: http://www.ncbi.nlm.nih.gov/pubmed/18418336
- Cervera MA, Soekadar SR, Ushiba J, Millán J del R, Liu M, Birbaumer N, et al. Brain-computer interfaces for post-stroke motor rehabilitation: a meta-analysis. Ann Clin Transl Neurol [Internet]. 2018 May;5(5):651–63. Available from: http://doi.wiley.com/10.1002/acn3.544
- Bischoff HA. Identifying a cut-off point for normal mobility: a comparison of the timed "up and go" test in community-dwelling and institutionalised elderly women. Age Ageing [Internet]. 2003 May 1;32(3):315–20. Available from: https://academic.oup.com/ageing/article-lookup/doi/10.1093/ageing/32.3.315
- Gajdosik RL, Bohannon RW. Clinical Measurement of Range of Motion. Phys Ther [Internet]. 1987 Dec 1;67(12):1867–72. Available from: https://academic.oup.com/ptj/article-lookup/doi/10.1093/ptj/67.12.1867
- Brown TH, Zhao Y, Leung V. Hebbian Plasticity. In: Encyclopedia of Neuroscience [Internet]. Elsevier; 2009. p. 1049–56. Available from: https://linkinghub.elsevier.com/retrieve/pii/B9780080450469007968
ACKNOWLEDGMENT
The work was funded by the FFG project recoveriX-Leg in Austria.