Adrien Pajon![]() 1,2
1,2![]() , Marie-Laurence Bazinet
, Marie-Laurence Bazinet![]() 1,2
1,2![]() , Jean Leblond
, Jean Leblond![]() 2
2![]() , François Routhier
, François Routhier![]() 1,2
1,2![]()
![]() 1
1![]() Department of Rehabilitation, Université Laval (Québec, Canada),
Department of Rehabilitation, Université Laval (Québec, Canada), ![]() 2
2![]() Centre for interdisciplinary research in rehabilitation and social integration, Centre intégré universitaire de santé et de services sociaux de la Capitale-Nationale (Québec, Canada)
Centre for interdisciplinary research in rehabilitation and social integration, Centre intégré universitaire de santé et de services sociaux de la Capitale-Nationale (Québec, Canada)
BACKGROUND
An estimated 43,000 individuals use powered wheelchair (PWC) users in Canada, a proportion representing ~15% of any wheeled mobility device use (manual wheelchairs, power wheelchairs and scooters) [1]. With a similar proportion of PWC use estimated in the USA, based on an estimate of 3.7M users of wheeled mobility devices, we can estimate the number of PWC user to be about 300,000 in the USA. Evidence supports that PWC can positively impact well-being, self-esteem, pain, activity, and participation of those individuals (e.g. [2–4]). Although several studies report various problems arising from vibrations that are experienced during wheelchair use (e.g. low-back and neck pain, muscle ache and fatigue [5, 6]), those studies mainly focus on long time PWC use and do not map the vibration response with the obstacle types, setting preferences or components selections. Therefore, it is difficult to determine the cause and impacts of vibrations, which may be important to inform PWC set-up, positioning and training.
Indeed, during the design and prescription of PWC, different settings and components can be chosen like wheel types, active wheel position, setup of shock absorbing systems, etc. When facing ground perturbations (GP) depending on their capacities and wheelchair characteristics, PWC users can react differently to perturbations and their reactive vibrations. In addition to be more or less comfortable, they can slide on the seat or even lose control of their PWC which can generate fatigue or, in a worst case, injuries. PWC manufacturers provide documentation on their products and some are known to have shock absorbers stiff or smooth. However, to our knowledge, there is currently no study nor metrics to quantify the effects of encountering GP on PWC user effort to remain in control.
OBJECTIVES
The objectives of the study present here were to: 1) propose a preliminary experimental method to measure vibration in various PWC set-ups (e.g. wheel types, spring and damper adjustments, cushions), and 2) demonstrate the proposed experimental method to capture vibrations generated on the seat of the PWC and the torso of the PWC user for one type of perturbation and three different wheel types.
METHOD DESCRIPTION
Human simulation
Given that the aim to develop an experimental method and to avoid biases from variability in human body shape, weight and morphology, a standardized dummy was used to simulate a human. Specifically, we used a headless 112kg test dummy based on the International Standards Organization 7176-11 standard on wheelchairs. To simulate the security seatbelt effects and avoid free falling too hard with difficult obstacles, the torso of the dummy was attached to the backseat using an elastic tensioner.
Ground perturbations (GP)
Different obstacles based on real-life situations can be used to simulate GP commonly encountered by PWC users, including speed humps, bumps and strips from the road, gravel, pothole, access ramp, and door thresholds.
Measurement apparatus
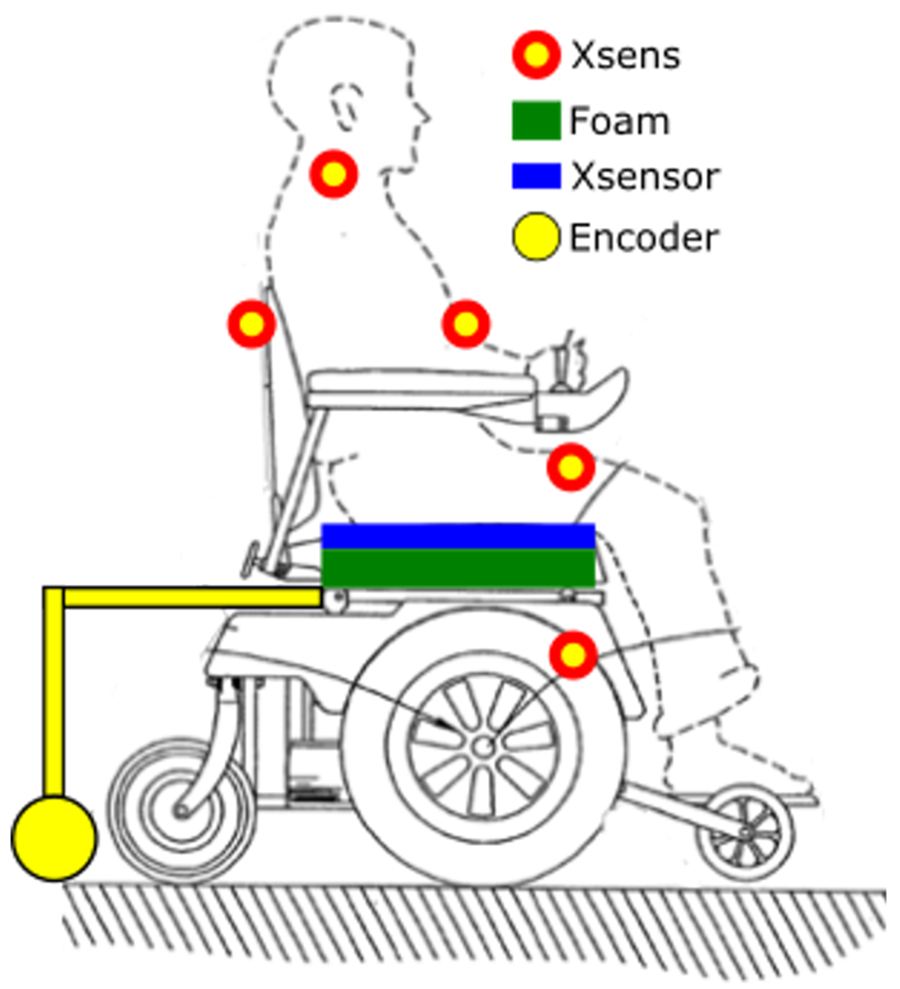
To track the motion and vibrations, we used 5 inertial motion units (IMU) from Xsens (MTiXsens of the MTw Awinda product), which integrate an accelerometer, a gyroscope and a magnetometer that all measure in 3D in a world frame oriented by the gravity and the magnetic north. They are positioned as followed: (i) in the middle of the dummy's thigh, (ii) in the middle of the dummy's torso, (iii) centered at the level of the dummy's shoulder, (iv) on the backseat in opposition to the IMU on the torso, and (v) centered on the seat base under the dummy's thigh. We used Xsens MT Manager software from MT Software Suite to record the data. To track the seating load and the center of pressure (CoP) under the buttocks, we used pressure mattress sensors (Xsensor ForeSite SS System) put on two superposed foam cushions (model: 2 inches HR VF 60) on the seat. Those cushions protected the Xsensor from the sharp edges of the seat. We used Xsensor ProV8 – 8.0 Build 107 software to record the data.
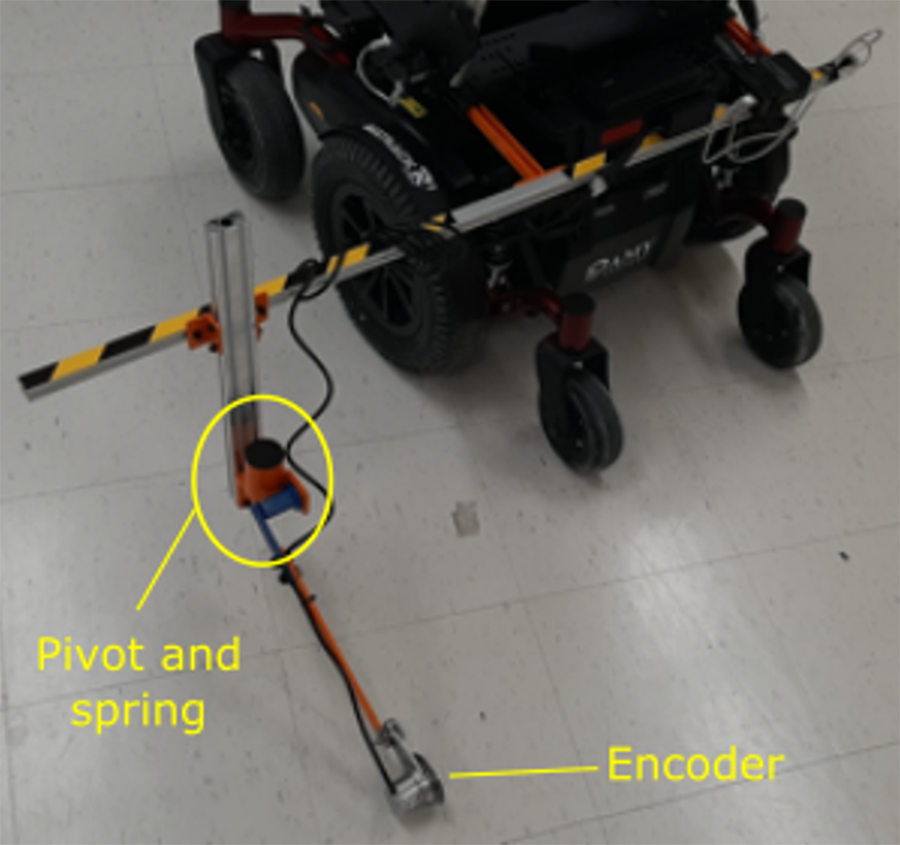
To track the PWC's speed when encountering the obstacles, we used an encoder (Sick DBV50E-22ALA2500, 2500 pulses/turn in quadrature = 10000 pulse/turn) and its usb interface (PhidgetEncoder HighSpeed 1057_2). The measures of the encoder were recorded by a small single-board computer (Raspberry Pi 4) powered by a power tank. We developed our own recording software in Python 3.7 based on Phidget python library and code samples. The mechanical setup allows to adjust encoder settings in height and lateral positioning. Figure 1 shows the lateral view of a wheelchair with the position of the sensors used. The assembly of the encoder is showed in Figure 2.
Sensors synchronization and signal analysis
Due to the different recording methods and software, the data captured by sensor was not time-synchronized. According to Prony's methods [7, 8]. sensor synchronization was achieved by a shock detection. A piece of wooden was placed on both the torso and the thigh of the dummy and hit with a hammer with a sufficient force to ensure the shock was visible on every measurement system and detectable using shock detection analysis.
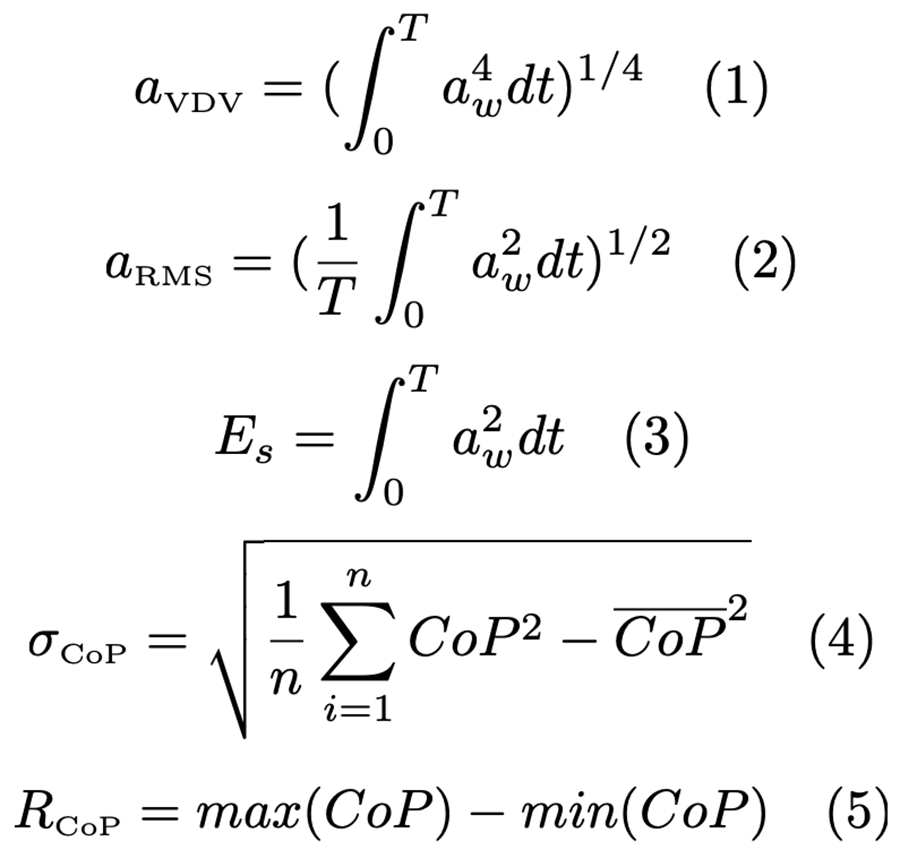
IMUs measure accelerations that are used to quantify the vibrations. According to the International Standards Organization 2631-1 standard on human vibration, the vibration dose value (VDV, Eq. 1) and root mean square (RMS, Eq. 2) methods applied on measured acceleration are used to evaluate the effects of vibration on health. The VDV primarily characterizes the amplitude of vibration when RMS characterize the oscillation. Higher scores are indicative of higher vibrations. However, RMS is averaged by the time period which depends on the experiment. It is useful to evaluate cyclical vibration over longer periods of time, but in our experimental case, vibration responses more closely resemble a shock than cyclical vibrations. Thus, the experimental time period can vary depending on the type of obstacle and does not allow to compare results between experiments with different obstacles. In that case, we choose to use instead the signal energy (Es, Eq. 3) which is qualitatively equivalent to RMS and is not averaged by the experimental time period. Finally, the IMU measures are given in a world frame and the horizontal directions are not oriented with the obstacle orientation or the direction of the PWC motion. To simplify the analysis, we choose to use the norm of the horizontal acceleration (named x-y axis) when the vertical direction is named z-axis.
A pressure mat measured the center of pressure (CoP) which is used to quantify the body displacement like sliding and, to a lesser extent, vibrations. We computed the standard deviation (s, Eq. 4) and range (R, Eq. 5) of the measured CoP. s gives information about the oscillation when R characterizes the amplitude of vibrations for the contact forces between the seat and the thigh of the dummy. The shock detection and signal analysis was done using the programming language Julia 1.2.0.
Statistical analysis
The statistical method used to analyze the data and obtain the significative impact of settings choices was rankFD [9]. PWC speeds, obstacle types and wheel types were defined as independent variables. Es, VDV, s (sigma) and R were defined as dependent variables. The statistical analysis was done with the package rankFD (version 0.0.5, January 28 2020) for the free software environment R (version 4.0.2).
Trial procedure
Each trial of the experiments were performed as follows: 1) verify and reposition the dummy and the elastic tensioner on the instrumented PWC if slipping, 2) position the PWC in front of the obstacle at a reasonable distance to attain a targeted speed when facing the obstacle, 3) start recording sensor measurement and initiate sensor synchronization, 4) start the PWC movement by an operator (who controlled the joystick beside the PWC) and drive toward the obstacle, 5) complete the obstacle, and 6) stop PWC movement and sensors measurement. To evaluate change in experimental variables, the trial was repeated at least 7 times to be statistically acceptable. To optimize each trial was repeated 10 times.
EXPERIMENT
To demonstrate the method, we conducted a preliminary experiment to determine if we could detect a difference in vibration response of PWC against perturbations with different wheel types.
A hybrid type PWC ALLTRACK R3 Hybrid (Amylior Inc., Vaudreuil, Canada) was used for the experiment. It was setup as follows: (i) the left armrest was removed to position the dummy, (ii) the original backseat was replaced by a backseat made of two aluminum sticks and an Acrylonitrile Butadiene Styrene (ABS) plate, and (iii) the cushion was removed and replaced by the two superposed foam cushions and the Xsensor on the seat. To control and drive the PWC during the experiment, the right armrest remained on the PWC and the control joystick was activated by an operator that walked alongside the PWC. During the experiments, we used three pre-programmed control speed: Low = 0,69m/s, Medium = 1,41m/s and High = 2,15 m/s. Those values were based on measurements from the encoder.
We chose to test door threshold as a GP simulated by planks (101mm x 1520mm) with different heights of 11mm, 16mm, 27mm and 32mm. Those planks are attached to the floor with brackets on one side and with double-sided tape on the other side, strong enough to avoid peeling off when the PWC drives on the obstacle.
We wanted to compare the vibration response of the PWC when facing GP with different wheel types. The front wheels (ø190mm) and driving wheels (ø330mm) were set together with three different wheel types to observe their characteristics when facing obstacles: 1) air: classical pneumatic tires filled with air and well inflated, 2) full: classical anti-puncture cast wheel tires filled with polyurethane foam, and 3) gel: classical pneumatic tires but filled with soft-elastic polyurethane foam instead of air based on RolkoSmart . The anti-tippers were not changed.
RESULTS and DISCUSSION
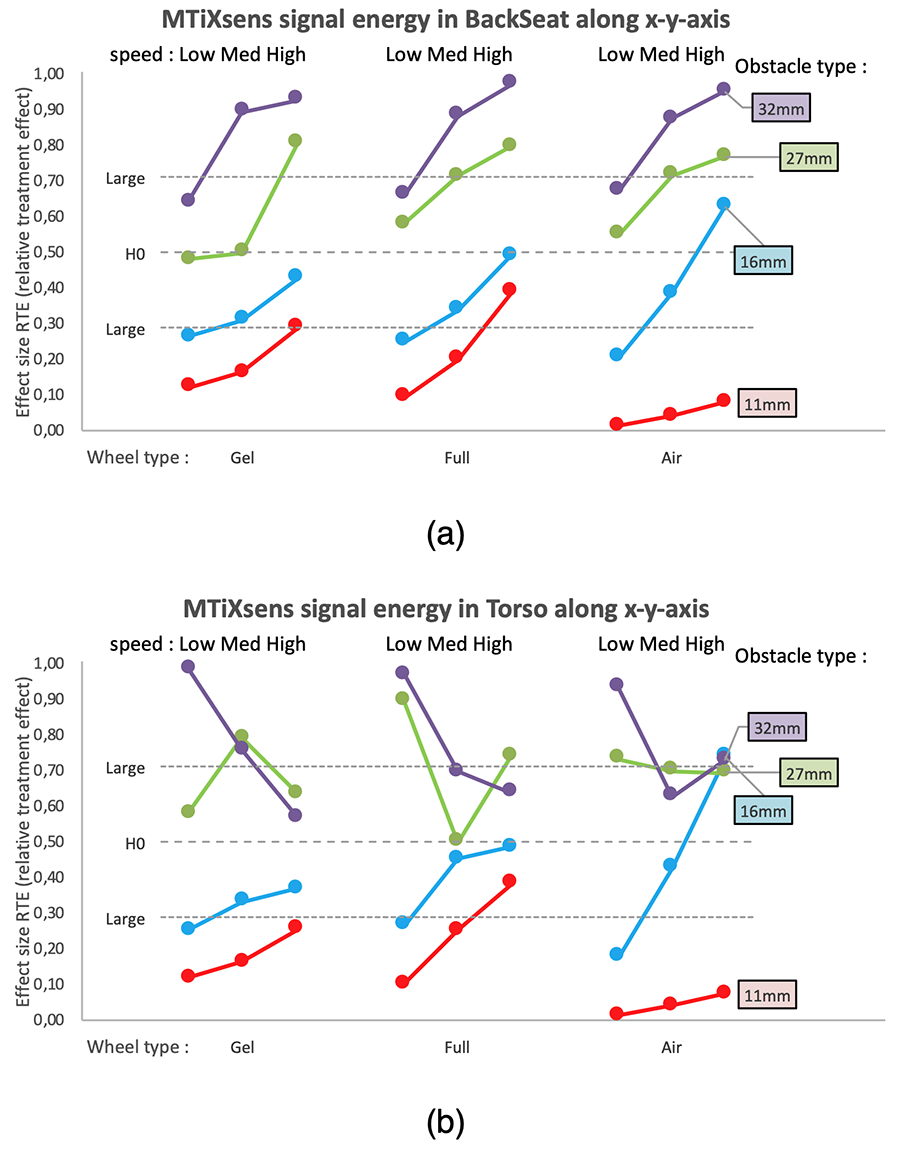
Fig. 3 shows the effect sizes of relative treatment effect (RTE) of the signal energy measured by the (a) backseat IMU and (b) by the torso IMU. An increase in vibrations with respect to the speed and to the size of the obstacle was qualitatively observed. However, Fig. 3 (b) shows, for obstacle 27mm and 32mm, an opposite behavior with the increase of speed. They can be induced by the falling torso when facing high obstacle. Indeed, the elastic tensioner chosen for the experimental setup was not strong enough to maintain the torso on the backseat against high vibrations. As Es and VDV are integer of powered acceleration, when falling, the torso is affected by no accelerations. Thus, Es and VDV are lower than expected without falling and with respect to the general vibrations of the PWC. Notably those of the backseat IMU which is positioned closely to the torso IMU.
The statistical analysis showed that all independent variables, obstacle height, speed and wheel type, and their interactions had a significative impact on Es and VDV (p < 0.05). However, the ratio between the vertical and horizontal vibrations (equivalent to the direction of the vibrations) was not significantly different with respect to the choice of the wheel type (p > 0.05). The comparison of wheel types shows that there was a significative difference between the air type wheel and both gel and full (p < 0.05) when the comparison between the gel and full does not shows a significative difference (p > 0.5). The mean of Es and VDV with any gel or full is higher than with air which implies that the air type wheel seems to generate less vibration than gel. However, from the effect size, vibrations seemed highly affected in one particular condition, air type wheel with 11mm obstacle. Finally, due to the dummy rigidity, the CoP did not change significantly (sCoP < 5mm and RCoP ~30-50mm) even when the torso was slipping which highly affected the range.
Such a protocol will allow for mapping vibration responses to different PWC settings preferences, components selections or type of obstacles. This way, understating the cause of various vibrations may provide clinicals with a tool for selecting specific PWC settings and components selection depending on the user's environments and the most likely and complicated perturbations the users can deal with. In future experiments, we will update the method by strapping more firmly the dummy torso on the backseat to avoid free falling against high perturbations. In addition, we will develop an instrumented backseat in order to track the torque applied to the torso, which will be easier to compare with clinical effects on the users than accelerations.
CONCLUSION
In this study, we presented a preliminary experimental method to measure vibrations in PWC use based on IMUs and pressure mattress sensors. Experimentation with the with door threshold obstacle comparing three wheel types (air, full and gel) suggested that gel type wheels generated less vibrations when facing obstacle with low height. This preliminary experiment showed that the sensor apparatus is precise enough to capture differences in speed, obstacle variation and wheel types. Although statistical differences were observed, clinical significance must now be determined.
In open-access at https://github.com/apajon/api_phidget_n_MQTT
Code and measure files in open-access at https://github.com/apajon/RESNA2021_vibration_analysis
REFERENCES
- Smith EM, Giesbrecht EM, Mortenson WB, et al. Prevalence of Wheelchair and Scooter Use Among Community-Dwelling Canadians. Phys Ther 2016; 96: 1135–1142.
- Salminen A-L, Brandt Å, Samuelsson K, et al. Mobility devices to promote activity and participation: a systematic review. J Rehabil Med 2009; 41: 697–706.
- Rousseau-Harrison K, Rochette A, Routhier F, et al. Impact of wheelchair acquisition on social participation. Disabil Rehabil Assist Technol 2009; 4: 344–352.
- Frank A, Neophytou C, Frank J, et al. Electric-powered indoor/outdoor wheelchairs (EPIOCs): users' views of influence on family, friends and carers. Disabil Rehabil Assist Technol 2010; 5: 327–338.
- Wolf E, Cooper RA, Pearlman J, et al. Longitudinal assessment of vibrations during manual and power wheelchair driving over select sidewalk surfaces. J Rehabil Res Dev 2007; 44: 573–580.
- Garcia-Mendez Y, Pearlman JL, Boninger ML, et al. Health risks of vibration exposure to wheelchair users in the community. J Spinal Cord Med 2013; 36: 365–375.
- Combet F, Martin N, Jaussaud P. Recovery of a high shock probability process using blind deconvolution. In: 2002 11th European Signal Processing Conference. 2002, pp. 1–4.
- Martin N, Jaussaud P, Combet F. Close shock detection using time–frequency Prony modeling. Mech Syst Signal Process 2004; 18: 235–261.
- Brunner E, Bathke AC, Konietschke F. Rank and Pseudo-Rank Procedures for Independent Observations in Factorial Designs: Using R and SAS. Cham: Springer International Publishing. Epub ahead of print 2018. DOI: 10.1007/978-3-030-02914-2.
Acknowledgements
This study has been funded by MITACS Accélération (Partnership with Amylior Inc., Vaudreuil, Canada)