Jeff Wilson, John Peifer
Georgia Institute of Technology, Atlanta, GA
ABSTRACT
Utilizing the Mobile Activity Monitor (MAM), we show that measuring seat pressure forces underneath the seat cushion is an effective means of estimating activity levels for two types of cushions. MAM is a mobile wireless activity monitoring system designed to track weight-shifts performed by wheelchair users. The system is intended to help prevent development of pressure sores and is designed to perform continuous activity measurements.
KEYWORDS: activity monitoring, pressure ulcers
BACKGROUND
The Mobile Activity Monitor, or MAM (1), is a wireless activity monitoring system developed for the purpose of monitoring weight shift activities of wheelchair users. The system is a portable device that wirelessly transmits activity data to a central server that can provide feedback to both the wheelchair user and skin care specialists through a web-based interface. The goal is to identify and prevent low activity behavior that is detrimental to skin health. In the MAM, weight-shift activity is measured by small, flat, low-cost force sensing resistors (FSRs) underneath the wheelchair cushion rather than on top. It was determined that placing the sensors underneath the cushion was the most appropriate placement to avoid potential skin problems as well as to reduce wear and tear on the sensors. Commercially available sensor arrays such as Force Sensitive Applications (FSA) are very expensive and prone to damage after long periods of use unattended by a seating specialist. Also, the type of sensors we chose requires mounting on a semi-rigid, flat surface (atypical of wheelchair cushions). Certainly, this under-cushion method of pressure sampling is not appropriate for creating an accurate pressure map of the user, as the cushion will smooth and partially redistribute the seat forces. However, tests conducted in this study show that weight shifts measured beneath the cushion are closely related to weight shift activity measured on the top of the cushion.
METHODOLOGY
In this paper we evaluate the accuracy of measuring activity underneath seat cushions. Fundamentally, any force applied to a wheelchair cushion must be passed to the supporting seat beneath the cushion. However, cushions are designed to even out the pressure against the users buttocks, particularly at the ischial tuberosities. In order to be able to measure activity underneath the cushion, the cushion must not completely mask changes in pressure related to the user shifting their weight. The experimental design was driven by the following hypothesis: Measuring and classifying activity of wheelchair users can be determined by measuring pressure changes at multiple points beneath the wheelchair user’s seat cushion. Note: Activity level is often defined as the rate at which calories are burned aerobically. However, for the purposes of this paper activity is defined as gross movements resulting in changes in the user’s center of gravity (e.g. left, right, forward shifts, etc.) and removal of weight (e.g. full shift, transfer, etc.).
Measuring pressure between the interface of a user’s buttocks and wheelchair seat cushion is a widely accepted means of measuring seat pressures. Furthermore, there are well-established, commercially available products for making these sorts of measurements (e.g. FSA, Tekscan, etc). The assumption is made for this study that seat pressure changes at this interface (on the top of the cushion) is an accurate means of measuring activity and has been used in previous studies involving long-term and mobile seat pressure collection (2). Therefore, a mat above the cushion is used as a control against measurements taken beneath the cushion.
 |
|---|
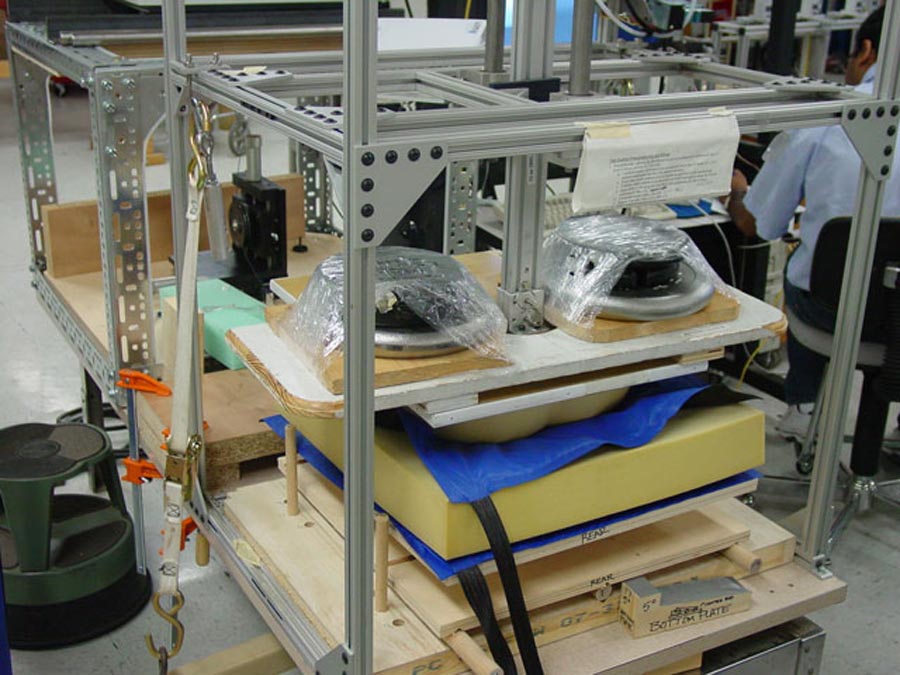
To accurately control seat pressure, an indenter buttocks model from the Georgia Tech Center for Assistive Technology & Environmental Access (CATEA) was utilized. The indenter that was available was not capable of being shifted while engaged with the seating surface. Therefore, an adjustable platform was created by CATEA staff to allow the cushion to be shifted underneath the indenter in a controlled manner (see photo 1). This method of facilitating controlled shift events was primarily driven by the constraints of the available indenter. This method is effective at simulating seat activities such as major weight shift events with different types of cushions. However, shifting the seat surface rather than the indenter is not appropriate for gel cushions due to the effects of gravity on the gel fluid.
The indenter (ISO35cm rigid buttocks model) was loaded to produce a total seating force of 500 N. The indenter is pneumatically assisted to allow for raising the buttocks model on and off the seat surface. For measuring seat pressures, we used FSA seat pressure mats (calibrated and tested during each data collection session). Two were used at the same time, one above and one below each tested cushion. FSA data collection was configured to collect raw data from both pads at 0.5 Hz (once every two seconds). The two tested cushions were a Roho Quattro and an IFD 45 reference foam.
A script was followed to generate the simulated activity. For instance, various shift events were executed following a schedule. These events included full shifts and left and right shifts, each separated by five minutes of the indenter fully loaded and upright. For the left and right shifts, the angle of inclination was controlled and set at 10 degrees. Typically, shift events lasted 30 or 60 seconds. Somewhat realistic behavior and duration of shift events was a desired goal rather than time intervals that would allow for complete settling of the cushions, which takes from 2 to 4 minutes (3).
The goal of this study was to test the hypothesis that activities detected and measured above the cushion (between the buttocks model and cushion) could be similarly detected below the cushion. Pressures were measured across the entire seat surface as measured by the FSA mat, and three metrics for activity were computed: 1) changes in center of pressure (COP), 2) changes in left-right pressure ratio, and 3) the moving-average adjusted MAM activity algorithm using the left and right half of FSA cells. The COP method was used as it is a common metric for detecting movement in a wheelchair (4). The pressure ratio method was selected, because is an intuitive way to look at activity. A correction factor was applied due to difficulties perfectly aligning the two mats for the COP method and the ratio method. The average COP X-value during a fully loaded, and upright position was used a baseline for comparisons between above- and below-cushion comparisons. The ratio method was adjusted similarly. Unlike the COP and pressure ratio methods, the MAM activity algorithm has the advantage of being able to calculate a baseline on the fly. This on-the-fly calculation allows the MAM to deal with asymmetric posture, cushion settling, and sensor drift.
RESULTS
Changes in the COP resulting from the scripted weight shift events occurred nearly equally for the above- and below-cushion FSA mats and for both cushions. Changes in COP as a result of going from a normal sitting position to a left or right shift resulted in the bottom FSA mat detecting approximately 83% of the relative COP change in the top FSA mat. Specifically, the COP changed by an average 2.4 inches on the top of the cushion and by an average of 2.0 inches beneath the cushion for the Roho. There was a 0.4 inches maximum difference in COP above and below for left and right shifts with the Roho cushion. The COP changed by an average 1.7 inches on the top of the cushion and by an average of 1.4 inches beneath the cushion for the foam cushion, and a maximum difference of 0.3 inches above and below was observed for the foam cushion. Comparisons of right-left pressure ratios were also compared above and below the cushion. The right-left pressure ratios were computed as the sum of all of the FSA pressure cell values on the left of the mat and dividing by the sum of all pressure cell values. Leaning to the left or right during a weight shift changes these simple ratios. Ratio changes were measured by pressure mats above and below the cushion. The bottom FSA mat produced ratio changes within 15% of the top mat for both cushion types.
 |
|---|
Comparisons of activity above and below the cushion were also performed for the MAM algorithm, which automatically applies a moving average adjustment to accommodate for posture changes and long-term changes in the sensors and cushion. The MAM measures activity as a shift percentage. The values are computed as the percentage of weight (relative to total weight) removed from either the left or right side of the cushion. Comparisons between MAM activity measurements above and below the cushion produced a maximum difference of 15% for the foam cushion and 20% for the Roho cushion. Graph 1 shows a comparison of activity above and below the Roho cushion using the MAM algorithm.
Transitions between an upright, fully loaded posture did show some disparity above and below the cushion for all three activity metrics. This is primarily because changes in pressure beneath the cushion lagged behind changes above the cushion. The Roho cushion caused more of a lag than the foam cushion. This makes sense due to the fact that the Roho responds more slowly to changes in seat pressure due to the reallocation of air in its chambers. Typically, this lag resulted in spikes in error of a very brief time period of around 1 second.
DISCUSSION
We have shown that a wheelchair user’s activity can be detected underneath their seat cushion nearly as well as above the cushion for a Roho Quattro and a reference foam cushion. Other types and brands of cushions may be equally suitable for under-cushion measurements but remain to be tested. By measuring underneath the cushion, one avoids problems with sensor cost, longevity, and negative impact on the user’s skin. While not a suitable technique for creating pressure maps to determine poor seating, under-cushion pressure sampling is suitable for observing activity in a minimally invasive way.
REFERENCES
- Wilson J, Peifer J, et al. Mobile Wireless Activity Monitoring to Prevent Pressure Sores in Wheelchair Users. Proceedings from RESNA 2004 Annual Conference in Orlando, Florida.
- Bain D, Ferguson-Pell M. Remote monitoring of sitting behavior of people with spinal cord injury. J Rehabil Res Dev. 2002;39-4:513-520.
- Crawford S, Stinson M, et al. Examining Changes In Pressure Mapping Output Parameters With Multiple Sclerosis (Ms) Clients (1): Standard Deviation And Number Of Activated Sensors. Proceedings from RESNA 2003 Annual Conf. in Atlanta, GA.
- Crawford S, Stinson M, et al. Examining Changes In Pressure Mapping Output Parameters With Multiple Sclerosis (Ms) Clients (2): Centre Of Pressure. Proceedings from RESNA 2003 Annual Conf. in Atlanta, GA.
Author Contact Information:
Jeff Wilson, MS
GA Tech
250 14 TH ST NW
Atlanta, GA,
Phone: (404) 894-7021
EMAIL: jeff.wilson@bitc.gatech.edu