Vladimir Kulyukin and John Nicholson
Assistive Technology Laboratory
Department of Computer Science
and
Center for Persons with Disabilities
Utah State University
Logan, UT 83422-4205
ABSTRACT
A method is presented for localizing visually impaired navigators indoors using wireless signals from Wi-Fi® wireless routers. The goal is a ubiquitous localization methodology that relies on wireless signals that are already present in a given environment and does not require any modification of that environment.
KEYWORDS
Visual impairment, blindness, assisted navigation, indoor localization, wireless networks.
BACKGROUND
There are approximately 11.4 million visually impaired people in the United States. Wayfinding, i.e., the ability to select and navigate a path in unknown indoor environments, is a major problem for visually impaired navigators [1]. Localization, i.e., the ability to determine one’s current position with respect to a critical landmark, is an integral part of wayfinding. Many localization solutions rely on the Global Positioning System (GPS) [2]. However, GPS does not work indoors, because GPS signals cannot penetrate the concrete and steel layers often found many modern buildings [3].
Several solutions have been developed for indoor localization. One prominent solution is the Talking Signs© technology developed at the Smith-Kettlewell Eye Research Institute in San Francisco [4].Talking Signs© is based on infrared sensors and operates like the infrared remote control device for television channel selection. Infrared beams carry speech signals embedded in various signs to hand-held receivers that speak those signals to users. More recently, the Atlanta VA R&D Center has proposed the concept of Talking Braille infrastructure [5]. Talking Braille is a method for providing access to Braille/Raised Letter (BRL) signage at a distance. Talking Braille is an adaptation of electronic infrared badge technology developed by Charmed Technologies, Inc. The Talking Braille infrastructure consists of small digital circuits embedded in standard BRL signs. Small badges worn by users remotely trigger signs in the user's vicinity.
Although Talking Signs© has been available for 20 years, it has not been widely used due to the high cost of installation [5]. While the Talking Braille infrastructure holds promise, its installation requires that every BRL sign in the building be equipped with a special chip and powered. Infrared sensors used in the Talking Braille infrastructure are subject to specular reflection, i.e., situations where the user’s badge receives a beam reflected off a surface other than the sending sensor, and require direct line of sight to avoid misdirection.
HYPOTHESIS
It is hypothesized by the investigators that indoor localization can be done by using wireless signals already available in many indoor environments due to the ubiquitous use of wireless Wi-Fi® networks. One advantage of this approach is that it does not require any modification of the environment, e.g., deployment of extra sensors or chips, which may negatively affect the designs of some organizations to make their environments more accessible to the visually impaired.
METHOD
 |
|---|
Kismet©, an open source wireless network detector, sniffer, and intrusion detection system, is used to detect and digitize wireless signal strengths. The software runs on a Dell™ Ultralight X300 laptop equipped with the Orinoco™ Classic Gold PC 802.11b card. A set of landmarks is selected in a given target environment. The wireless signature of each landmark consists of the signal strengths from the wireless access points detected in the environment. Once collected at a landmark, the signal strengths are processed with a neural network [6]. At run time, signal strengths are classified to a landmark.
 |
|---|
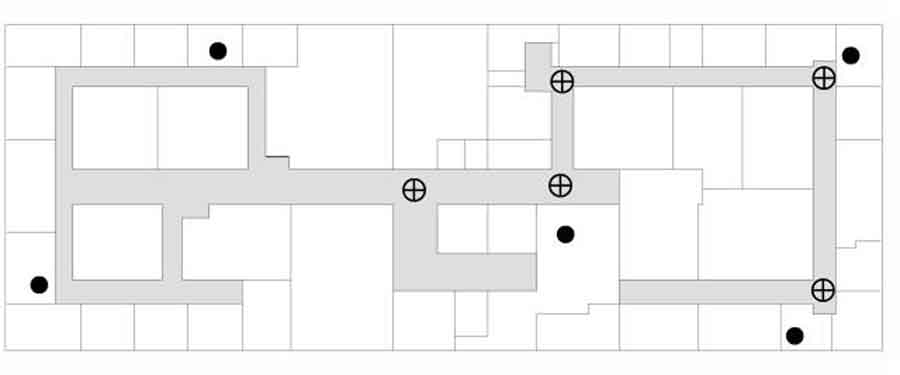
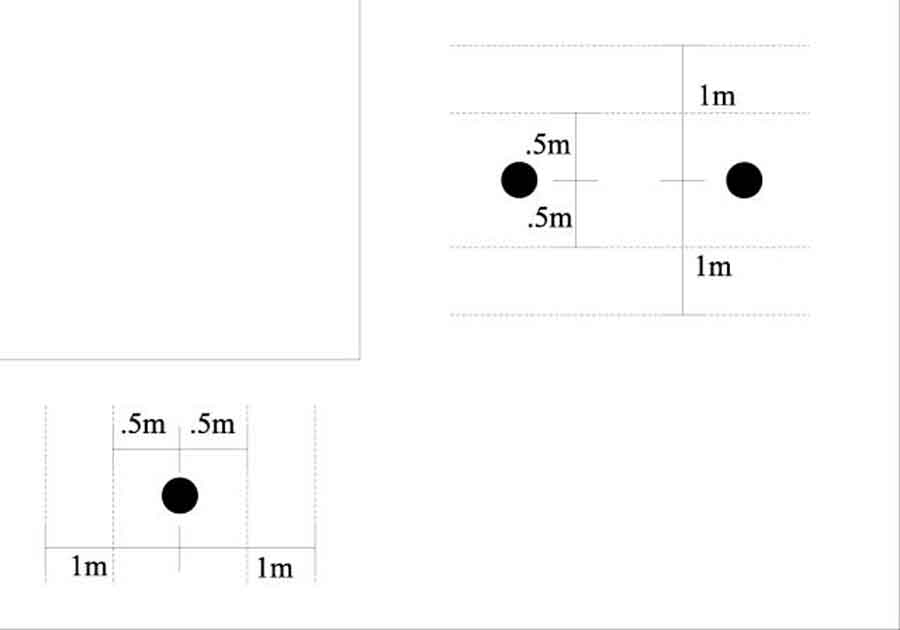
As shown in Figure 1, five wireless access points were placed at various locations in the USU CS Department. Data were collected for five different locations. A single reading in both the training data and the validation data consisted of the signal strength for each wireless access point. The signal strengths were taken every 10 microseconds. As shown in Figure 2, when collecting the training data, the user stood 1.5 meters from the actual location for two minutes at a time. The laptop with the wireless card was placed on the user’s back. Since the human body affects signal strength, data were collected twice at each collection position, once for each direction of the hall. Data were collected over 10 days in the two minute increments, resulting in a total of 20 minutes worth of data for each direction of a hall at each location. If the hall was less than 2 meters wide, then only one collection position was used. Otherwise, two collection positions were used in order to account for the larger area in which a person could walk. The neural network method used five networks, one for each corner. Each network consisted of 4 layers: the input layer with five inputs, one for each access point, two hidden layers with 10 nodes each, and an output layer with one node. The network was fully connected and trained using backpropagation. The location whose network reported the highest output value, was reported as the classification for that set of signal strengths.
The validation data were collected during walks. Four tape markings were placed on the floor on two sides of each location so that when walking past a location a user would walk over all four markings. Two markings were placed a half meter on each side of the collection position and two markings were placed one meter on each side of the collection position. The user walked from location 1 to location 5, and as he walked, he used the system to record each time he walked over a tape marking. During the entire walk signal strengths were recorded. The evaluation results are shown in Table 1.
| Location 1 | Location 2 | Location 3 | Location 4 | Location 5 | |
|---|---|---|---|---|---|
| Sensitivity | 0.92 | 0.96 | 0.68 | 0.76 | 0.96 |
| Specificity | 0.99 | 0.98 | 0.96 | 0.94 | 0.97 |
| PPV | 0.99 | 0.94 | 0.81 | 0.77 | 0.90 |
| NPV | 0.98 | 0.99 | 0.92 | 0.94 | 0.99 |
RESULTS
As shown in Table 1, the localization performance was 90% or above at locations 1, 2, and 5. The performance at locations 3 and 4 ranged from 70% to 96%. Subsequent analysis of data revealed that the signal strengths of most access points at those locations are the same and cannot be distinguished by the neural network at run time. The reason for this is that the two locations are within 3.5 meters of each other.
DISCUSSION
The results seem encouraging to the investigators. A valuable insight obtained from the experiments was that for the localization accuracy to be maximized, landmarks must be chosen so that they do not reside in the close physical proximity of each other. Work is underway to evaluate other classification algorithms, e.g., C4.5 and Bayes [6] on the available data.
REFERENCES
- LaPlante, M. P. & Carlson, D. (2000). Disability in the United States: Prevalence and Causes. Washington, DC: U.S. Department of Education.
- http://www.senderogroup.com/gpsflyer.htm. “What is GPS-Talk?” Sendero Group, LLC.
- Abowd, G., Mynatt, E. (2000). Charting Past, Present, and Future Research in Ubiquitous Computing. ACM Transactions on Computer-Human Interaction, 1(7), 29-58.
- Marston, J. & Golledge, R. (2000) Towards an Accessible City: Removing Functional Barriers for the Blind and Visually Impaired: A Case for Auditory Signs. Technical report, Santa Barbara, CA: Department of Geography.
- Ross, D. (2004). Talking Braille: Making Braille Signage Accessible at a Distance. Proceedings of RESNA 2004, Orlando, FL.
- Mitchell, T. (1997). Machine Learning. New York: McGraw-Hill.
ACKNOWLEDGMENTS
The study was funded by two Community University Research Initiative (CURI) grants from the State of Utah (2003-04 and 2004-05) and NSF Grant IIS-0346880. The authors would like to thank Mr. Sachin Pavithran, a visually impaired training and development specialist at the USU Center for Persons with Disabilities, for his feedback on the localization experiments.
Author Contact Information:
Vladimir Kulyukin, Ph.D.
Assistive Technology Laboratory
Department of Computer Science
Utah State University
4205 Old Main Hill
Logan, UT 84322-4205
Office Phone (435) 797-8163
EMAIL: vladimir.kulyukin@usu.edu.