Amanda Manko![]() 1
1![]() , Patricia Karg
, Patricia Karg![]() 1
1![]() , David Brienza
, David Brienza![]() 1
1![]() , Alexandra Delazio
, Alexandra Delazio![]() 1
1![]()
![]() 1
1![]() University of Pittsburgh, Department of Rehabilitation Science and Technology
University of Pittsburgh, Department of Rehabilitation Science and Technology
INTRODUCTION
Pressure injuries can develop as a result of large and sustained tissue deformations while sitting. [1] Because of the nature of wheelchair use, extended periods of sitting occur and can be compounded by impaired sensation of the thighs and buttocks. Pressure injury treatment is lengthy, expensive, and severely limits functional capacity. [2] Wheelchair cushions of varying constructs are used to combat risk and aid in body positioning, stability, comfort, and pressure distribution.
Over time, wheelchair cushions experience changes which affect the way they perform. The RESNA WC-3 seating standards outline performance tests used to characterize changes in cushion properties before and after simulated aging. [3] The aim of this study is to determine the effects of simulated aging on cushion performance related to hysteresis. Hysteresis measures the energy lost to the cushion during a cycle of loading and unloading. Hysteresis metrics are typically interpreted in two ways: indicative of energy absorption during impacts and facilitating the user's return to erect posture after functional leans.
METHODS
A cohort of 21 cushions with a range of characteristics was selected to represent those commercially available at the time of testing. The cushions were grouped for analysis according to primary material (foam, air, foam+fluid, and honeycomb), general cushion category (general use, skin protection, and adjustable skin protection), and contour level (none, low, moderate, and high). The cushion cohort was subjected to two rounds of minimal methods for simulated aging as outlined in RESNA WC-3 Section 6. [3] These methods simulate aging due to repetitive loading, laundering and disinfection, and accelerated heat aging. The protocol is intended to approximate 18-24 months of actual use. For this study, the cushions underwent baseline testing prior to any simulated aging (Pre-Aging), followed by the first round of simulated aging methods and characterization testing (Post-Aging 1). In order to determine the effect that further aging would have, the cushion cohort was subjected to a second round of aging and characterization testing (Post-Aging 2). The distribution of cushion characteristics is shown in Table 1.
| Cushion Designation | General Cushion Category | HCPCS Code | Primary Material | Contour Level |
|---|---|---|---|---|
| A | General Use | E2601 | Honeycomb | Moderate |
| B | General Use | E2601 | Foam | Low |
| C | General Use | E2601 | Foam | None |
| D | General Use | E2601 | Air | None |
| E | Skin Protection | E2603 | Honeycomb | None |
| F | Skin Protection | E2603 | Foam + Fluid | None |
| G | Skin Protection | E2603 | Foam | Moderate |
| H | General Use | E2605 | Foam | Moderate |
| I | General Use | E2605 | Foam | High |
| J | General Use | E2605 | Foam + Fluid | Low |
| K | Skin Protection | E2607 | Honeycomb | High |
| L | Skin Protection | E2607 | Foam | None |
| M | Skin Protection | E2607 | Foam + Fluid | High |
| N | Skin Protection | E2607 | Foam + Fluid | Low |
| O | Skin Protection | E2607 | Foam | Moderate |
| P | Adjustable | E2622 | Foam + Fluid | High |
| Q | Adjustable | E2622 | Foam + Fluid | Moderate |
| R | Adjustable | E2622 | Air | None |
| S | Adjustable | E2624 | Foam + Fluid | High |
| T | Adjustable | E2624 | Air | None |
| U | Adjustable | E2624 | Foam | Moderate |
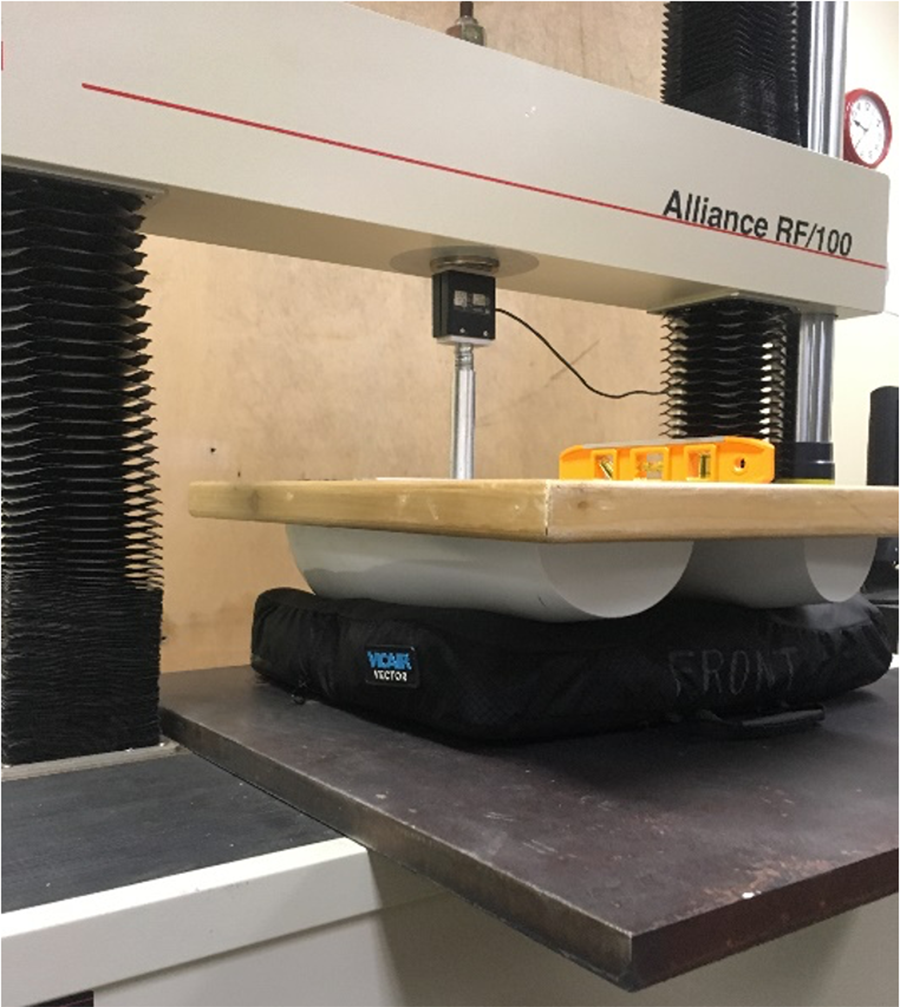
Hysteresis is performed with a Rigid Cushion Loading Indenter (RCLI) attached to a loading rig (Alliance RF 100, MTS Corporation). The RCLI is designed to represent the average adult male buttock and thigh dimensions. [3] The loading rig applies a continuous loading cycle from 8N to 750N then back to 8N at a rate of 1 mm/s. Cushion thickness under the base points (the lowest points) of the RCLI are measured throughout the cycle. Following each of 3 trials, the cushion is reset and rests for a minimum of 300s to allow for full recovery. The metrics of interest are hysteresis indices at 250N (h250) and 500N (h500) represented as percentages:
Data analyses were conducted using IBM SPSS Statistics 25 software. Wilcoxon Signed Ranks test was utilized to assess the statistical significance of differences between means after each aging cycle. In addition, effect size was calculated for each metric. Magnitude of small, medium, and large effects were categorized as 0.0 to 0.3, 0.4 to 0.6, and 0.7 and above, respectively.
As contour level, primary material, and general cushion category are categorical, the data was first recoded into binary variables with foam, skin protection, and cushions without contour used as the reference variables. A linear regression was then used to determine relationships between the categorical data and the change in hysteresis metrics from pre-aging to post-aging 1 and pre-aging to post-aging 2. An alpha level of .05 was used for all statistical tests.
RESULTS
Cohort Results
Table 2 shows the resulting means within the cushion cohort. Decreased hysteresis values are seen after both cycles of aging for 250N and 500N. Additionally, changes after both aging cycles were statistically significant for each metric. All changes had a medium effect, except hysteresis at 500N from pre to post-aging 2 which had a large effect. Spearman correlations were conducted to determine if a relationship between change in hysteresis metrics and change in thickness under the basepoints occurred from pre to post-aging 1 and pre to post-aging 2. No significance was found in any case.
| Variable | Pre-Aging Mean (SD) | Post-Aging 1 Mean (SD) | Post-Aging 2 Mean (SD) | ||
|---|---|---|---|---|---|
| Pre vs. Post 1 p-value | Pre vs. Post 1 Effect Size | Pre vs. Post 2 p-value | Pre vs. Post 2 Effect Size | ||
h250 (%) |
15.20 (8.94) | 14.09 (8.03) | 13.62 (8.23) | ||
| .021 | -0.5 | .003 | -0.6 | ||
h500 (%) |
11.10 (5.77) | 9.85 (4.75) | 9.08 (4.69) | ||
| .039 | -0.5 | .000 | -0.8 | ||
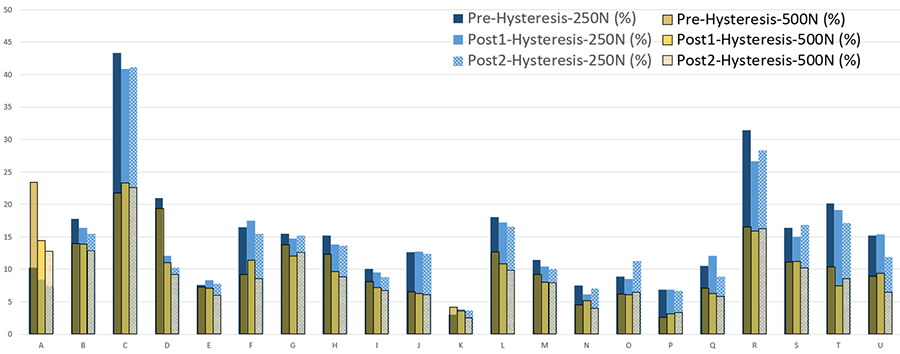
Figure 2 shows the results by cushion across both aging cycles. Outcome variable h250 is higher than h500 in all cushions except A and K.
Significant Relationships
Table 3 shows the p-values resulting from linear regressions between the change in hysteresis metrics after aging and the cushion categories. Regression analyses were conducted between one category (primary material, general cushion category, or contour level) and one metric at a time, though the results are shown in a combined table. From pre-aging to post-aging 1, changes in h250 were significantly correlated with air (p=0.014) and no contour (p=0.021) cushions. From pre-aging to post-aging 2, changes in h250 were significantly correlated with general use (p=0.028) and no contour (p=0.010) cushions. Variable h500 was not significantly correlated with any cushion characteristics but approached significance with general use (p=0.088) and no contour (p=0.056) cushions.
|
h250 Pre - Post-Aging 1 |
h250 Pre - Post-Aging 2 |
h500 Pre - Post-Aging 1 |
h500 Pre - Post-Aging 2 |
Foam |
.155 |
.152 |
.464 |
.172 |
Air |
.014 |
.072 |
.169 |
.297 |
Foam+Fluid |
.312 |
.732 |
.537 |
.576 |
Honeycomb |
.487 |
.705 |
.164 |
.131 |
General Use |
.069 |
.028 |
.090 |
.088 |
Skin Protection |
.792 |
.851 |
.716 |
.275 |
Adjustable |
.563 |
.210 |
.875 |
.945 |
Contour: None |
.021 |
.010 |
.401 |
.056 |
Contour: Low |
.463 |
.370 |
.615 |
.472 |
Contour: Moderate |
.263 |
.229 |
.221 |
.567 |
Contour: High |
.196 |
.283 |
.918 |
.514 |
DISCUSSION
Cohort Trends
According to the test rationale provided within the standard, cushions with larger hysteresis values will tend to absorb energy when used on rough surfaces or when dropping down steps, rather than transfer the impact energy to the user's tissues. [3] Although, the loading rates in the test are much slower than when a user encounters these conditions. Cushions with large hysteresis values may also tend to remain conformed to the user's shape for a time after unloading. As shown in Table 2, hysteresis at both 250N and 500N significantly decreased with continued aging. Overall, for the h250 metric, decreasing values were found in 67% of cushions after the first aging and 81% of cushions after the second aging. For the h500 metric, decreases after aging cycles were found in 71% and 86% of cushions, respectively. The lower hysteresis percentages post aging may indicate more consistent support during buttock-cushion loading-unloading but increased tendency for the cushion to deform the user's tissue due to the higher support forces during unloading. As no relationship between the change in hysteresis metrics and change in cushion thickness occurred, the decreasing hysteresis metrics across aging do not appear to indicate a change in cushion stiffness. Because hysteresis may shed light on the effects of impact and leaning, it is important to consider both magnitude of hysteresis values and difference between both metrics when assessing the results.
Close examination of the data as shown in Figure 2, indicates that all cushions except cushions A and K had lower hysteresis values at 500N than at 250N, which is the expected outcome of aging as cushions loose elasticity. As the cushion is decompressed after a loading cycle, ideally it would immediately begin to expand back to its original thickness. For cushions A and K, both honeycomb constructs, h500 is greater than h250 at the pre-aging timepoint. This trend is also found in cushion A at post-aging 1 and 2. Through equations 1 and 2, it can be determined that the ratio of thicknesses is smaller at 500N than at 250N. This may be due to a delay in the expansion of the honeycomb cells after unloading. It is interesting to note that this trend is also seen in cushion E, the third honeycomb cushion. While h500 is not larger than h250 in this case, there is less than a 1% difference at pre-aging.
Significant Relationships Between Metrics and Cushion Characteristics
An additional area of interest is the presence of relationships between the change in testing metrics from pre-aging to post-aging 1 and pre-aging to post-aging 2 and cushion grouping characteristics, including primary material, general cushion category, and contour level.
Overall, air cushions tended to be the main driving factor behind the decreasing metric means of the cohort, with 100% of these cushions experiencing decreases in h250 and h500 after both aging cycles, although this may be attributable to cushion set up. When observing the individual cushion results, cushion D has an abnormally large pre-aging result (Figure 2), thus leading to large changes across aging timepoints. Pre-aging values for cushion R are also higher than average. This greatly contributes to the significance found in air, general use, and no contour categories as shown in Table 3, as cushion D has all of these characteristics and cushion R has both air and no contour characteristics. Further analysis would be required to confirm the validity of the relationship and if significant effects still exist after removal of these outliers.
CONCLUSION
The minimum method for simulated aging as outlined in the RESNA WC-3 standard had a significant effect on cushion performance within hysteresis testing. Significant decreases in both metrics at the cohort level occurred from pre to post-aging 1 and pre to post-aging 2 with medium to large effects. Additionally, significant relationships were found between the change in hysteresis metrics due to aging and cushion characteristic categories of air, general use, and cushions without contour.
REFERENCES
- Sonenblum, S. E., Vonk, T. E., Janssen, T. W., & Sprigle, S. H. (2014). Effects of wheelchair cushions and pressure relief maneuvers on ischial interface pressure and blood flow in people with spinal cord injury. Arch Phys Med Rehabil, 95(7), 1350-1357. doi:10.1016/j.apmr.2014.01.007
- Russo, C. A., & Elixhauser, A. (2006). Hospitalizations Related to Pressure Sores, 2003: Statistical Brief #3. In Healthcare Cost and Utilization Project (HCUP) Statistical Briefs. Rockville (MD): Agency for Healthcare Research and Quality (US).
- RESNA (2018). RESNA American National Standard for Wheelchairs - Volume 3: Wheelchair Seating. Rehabilitation Engineering and Assistive Technology Society of North America. Arlington, VA.