Wheelchair Rider Incidents on Public Transit Buses: A 4-Year Retrospective Review of Metropolitan Transit Agency Records
Karen Frost1, PhD MBA, Gina Bertocci1,2, PhD PE
1University of Louisville RERC on Wheelchair Transportation; 2Mechanical Engineering Dept.
ABSTRACT
This paper characterizes incidents that occur on large, public transit buses involving wheeled mobility devices . A retrospective study of wheelchair-related incident reports for the period 2002 – 2005 was conducted in collaboration with a metropolitan transit agency. Eighty-three incidents were examined. Results indicate that the majority of incidents occurred when transit buses were stopped (73.2 %). Most incidents took place on the lift/ramp (59.3%) or outside the bus before or after ingress/egress (27.1 %). Injury events revealed a similar pattern. More than fifty percent of all injuries occurred buses were stopped (55.2%) and the majority of these injuries occurred on the lift/ramp (75%) . These findings have important implications for both equipment manufacturers and transportation providers.
KEYWORDS
Wheelchair transportation, public transit buses, wheelchair incidents, injury
BACKGROUND
Public transportation is an important mode of transport for many wheelchair users. To date there are no published studies in the scientific literature describing the characteristics of wheelchair-related incidents that occur on large, public transit buses. Yet over the past three decades consensus has held that large, public transit buses are a safe mode of travel for wheelchair passengers1-5 . This consensus is largely based on limited injury and fatality data from the National Electronic Injury Surveillance System (NEISS). A major limitation of the data on which this consensus is built is inherent in the NEISS database. NEISS data is based on a sampling of 95 of approximately 6,000 hospitals in the US that have an emergency department, or accommodate emergency visits on a 24-hour basis. Injuries presented outside of the emergency setting, either to private practice physicians, urgicare centers or other medical facilities are not reflected in these estimates. Furthermore, researchers have cautioned that the process of condensing hospital chart data into the NEISS database results in variations in the quality of data recorded3. Shaw (2000) recognized this limitation and sought to estimate injury risk using the Fatality Analysis Reporting System (FARS) database. He was unable to obtain sufficient injury data on wheelchair users riding in large, heavy vehicles such as transit buses and had to derive an estimate from general population fatality data. He estimated a fatality rate for wheelchair users of .01 injuries per 100,000 miles traveled5 as a proxy for an injury risk rate.
Songer et al. (2004) took a different approach and investigated injury risk and characteristics of accidents resulting in wheelchair-related injuries based on accounts from wheelchair users themselves6. Songer et al. conducted a nationwide survey of 596 wheelchair users. Sixty-one percent (61%) of wheelchair users surveyed reported regularly riding as passengers in public vehicles, and 20% reported that public transportation was their primary mode of travel. Participants were queried on the frequency of injuries as a result of non-crash situations. Non-crash situations were operationalized to include situations such as quick or sudden braking, sudden or sharp turning and quick acceleration. From these accounts, Songer et al. estimated an injury risk rate of 5.2 injuries per 100,000 miles traveled for public transit passengers who remained seated in their wheelchair while traveling.
The difference in injury risk rates calculated by Shaw and Songer et al. (.01 injuries/100,000 miles vs. 5.2 injuries/100,000 miles) highlights the need for additional research regarding injurious incidents among wheelchair riders using public transportation. A considerable portion of the difference between Shaw and Songer et al.’s injury risk rates may be attributed to differences in source data and methodology (i.e. differences in operationalizing injury). Both researchers state that injuries often occur during normal or emergency driving maneuvers on public transit buses as opposed to vehicle crash scenarios. However, little additional information exists to characterize incidents that result in injury when using public transportation.
The National Highway Traffic Safety Administration (NHTSA) analyzed NEISS data on wheelchair user injuries and deaths associated with motor vehicle incidents that occurred during the period 1991-19957. Incidents involved vans, passenger cars, buses, ambulances and trucks. Thirty-five percent of injuries or deaths were due to improper or no securement (35%), and 17% of these incidents occurred in buses. Another 25% of overall injuries or deaths were due to lift malfunctions or falling from a ramp during ingress/egress. A Project Action study of an urban transit system provided some insight into injury causation in wheelchair-seated passenger on transit buses, and found that wheelchair incidents occurred during both normal driving and sudden stopping8. These incidents were thought to be associated with improper securement, tiedown failure and/or wheelchair failure. These findings highlight the need for an improved understanding of wheelchair and adaptive equipment performance in public transportation.
In this study, we investigated wheelchair-related incidents occurring on large, public transit buses serving a metropolitan region by categorizing vehicle motion, driving condition and wheelchair activity believed to be associated with injury during the transportation process . We also quantified reports of injury. We believe this approach can aid in guiding future research on safety issues in public transportation, and will help transit authorities improve safety for users of wheeled mobility devices (WMDs).
METHODS
Incident reports involving passengers using WMDs for the four-year period 2002 – 2005 were obtained from the Transit Authority of River City (TARC) in Louisville, KY. TARC operates 285 large, public transit buses and serves the Louisville metropolitan area population of 1.2 million. TARC transit operators are required to complete written incident reports at the time of incident or prior to completing a shift. Incident reports include both categorical and narrative data. Incident reports detailing verbal disputes not relevant to the area of study (i.e. disputes regarding fares) were excluded. Sixty-four incident reports spanning the four-year period met the criteria for analysis. Descriptive statistics were generated using SPSS statistical software.
RESULTS
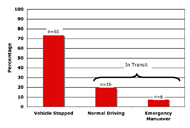
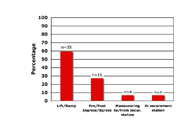
Eight-three incidents met the inclusion criteria. The predominance of WMD-related incidents involved males (61.7 %) compared to females (38 .3 %). Most incidents occurred when the transit bus was stopped (73.2 %) rather than in transit (26.8 %) (Fig 1). The majority of incidents that occurred when buses were stopped took place on the lift/ramp (59.3 %), followed by incidents occurring outside the bus before or after ingress/egress (27.1 %; ex. falls due to uneven sidewalk or hitting a curb), and incidents happening inside the bus during maneuvers to/from the securement station (6.8 %), and incidents occurring at the securement station (6.8 %) (Fig 2). Of the twenty-two incidents that occurred in transit, sixteen (72.7 %) occurred under normal driving conditions and six (27.3 %) occurred during emergency maneuvers (sudden braking or vehicle swerving). N o incidents involved a transit bus crash (Fig 2).
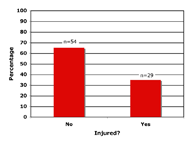
Injury assessment was made by each transit operator at the time of incident, and consisted of the transit operator asking whether or not the passenger was injured, and recording the passenger’s response. As shown in Figure 3, the majority of responses (n=54) indicated no injury as a result of the incident (65.1 %). Of the twenty-nine injury events reported (34.9 %), emergency medical services (EMS) were provided in ten instances (34.5 %). Interestingly, most injuries (n=16) occurred when the transit bus was stopped (55.2%). Twelve injuries occurred on the lift/ramp, two occurred before or after ingress/egress, and one occurred at the securement station (no location was documented for the last injury). These injuries accounted for four of ten (40 %) EMS events . No additional information or follow-up medical queries were documented.
 Figure 3. Percentage of WMD Users Reporting Injury at Time of Incident (Click image for larger view)
Weather condition did not appear to play a major role in the occurrence of incidents, but it is less clear if weather influenced injury outcomes. Weather was categorized as fair/dry in 84.1 % of incidents. Thirteen incidents (15.8 %) occurred during rain or mist conditions. Five of these incidents (38.5%) resulted in a reported injury and two of these required EMS.
DISCUSSION
This study provides new information indicating that the majority of injurious incidents involving WMD-users on large, public transit buses occur when the bus is stopped rather than in transit. Previous research has focused on assessing injury risk during driving and crash conditions. However, our findings indicate that WMD-users have a greater chance of incurring injury during ingress or egress than during transit. These results differ from the report by NHTSA that identified improper or no securement as the primary activity related to wheelchair user injury/death7. This difference may be due to the fact that the NEISS data used by NHTSA included incidents involving all motor vehicles, while our findings are based solely on incidents occurring in large transit buses. Although emergency medical services were required for only a small number of incidents (n=10 ) in this study, it would be hasty to conclude that the majority of incidents on large, public transit buses do not result in serious injuries because no effort was made to obtain follow up data regarding injured passengers’ medical status. These findings have important implications for transportation providers regarding driver training and operating procedures. Equally important are implications for improvements to the design of wheelchair lifts/ramps and wheelchair securement and occupant restraint systems.
ACKNOWLEDGEMENTS
The authors wish to thank TARC for sharing this valuable information, especially Russ Rakestraw. We also acknowledge Raymond D’souza, BSME for his willing assistance in collecting this data. This study was funded by the National Institute on Disability and Rehabilitation Research (NIDRR) and the Rehabilitation Engineering Research Center (RERC) on Wheelchair Transportation, grant H133E060064 . The opinions expressed herein are those of the authors and are not necessarily reflected of NIDRR opinions.
REFERENCES
- Booz, Allen and Hamilton, Inc. (1977). Summary Report: Transbus safety and human factors. No TR77-004, US DOT.
- Langwieder K, Danner M, Hummel T, (1985). Collision types and characteristics of bus accidents – their consequences for the bus passengers and the accident opponent. Experimental Safety Vehicles: 585-594.
- Richardson H, (1991). Wheelchair occupants injury in motor vehicle-related accidents. National Center for Statistics and Analysis, Mathematical Analysis Division, National Highway Traffic Safety Administration, US Dept. of Transportation.
- Shaw G, Gillispie T, (2003). Appropriate protection for wheelchair riders on public transit buses, J Rehab Res Develop, 40(4), 309-319.
- Shaw G, (2000). Wheelchair rider risk in motor vehicles; a technical note. J Rehab Res Develop, 37(1), p. 89-100.
- Songer T, Fitzgerald S, Rotko K, (2004). The injury risk to wheelchair occupants using motor vehicle transportation. Annual Proc Assoc Adv Automotive Med, 48 p. 115-29.
- National Highway Traffic Safety Administration (NHTSA) National Center for Statistics and Analysis. Wheelchair Users Injuries and Deaths Associated with Motor Vehicle Related Incidents. Research Note. September 1997. Retrieved from, www.nrd.nhtsa.dot.gov/pdf/ nrd-30/NCSA/RNotes/1997/Wheelchr.pdf.
- Project Action, Final Report: Positioning and securing riders with disabilities and their mobility aids in transit vehicles: designing and evaluation program. ECRI, 1995.
Karen L. Frost
Injury Risk Assessment & Prevention Laboratory
University of Louisville
Instructional Building - Room 110
500 S. Preston Street
Louisville, KY 40292
(502) 852-0279, (502) 852-0390 (fax),
k.frost@louisville.edu
Highlights
- Source Ordered
- No Tables
- Very Compatible
Gargoyles
Disney produced a television show in the mid 1990s called Gargoyles. It's a great show and I'm a big fan. A few years ago Disney started to release the show on DVD. The last release was of season 2, volume 1. That was two years ago. Volume 2 has not been released. Why? Poor sales. So if you should find yourself wanting to support my work, instead I ask you pick up a copy of season 2, volume 1. It's a great show and you might find yourself enjoying it.

