A Questionnaire to Research India’s Capacity for a Power Wheelchair
Alexandra Jefferds, Jon Pearlman, MSc., Rory A. Cooper, PhD.
Human Engineering Research Laboratories - University of Pittsburgh, VA Healthcare System Pittsburgh
Pittsburgh, PA 15206
ABSTRACT
As part of our efforts to design a power wheelchair for India, we have developed a web application to survey experts about photographs of Indian living environments. This paper describes the development process of the web application, including the technology behind the application and the criteria that influenced our presentation of the source data. Our study was designed to be adaptable to other data collection applications, and researchers can view the results in real time through a report web page.
KEYWORDS
Participatory research, online questionnaire, India, assistive technology, survey research
BACKGROUND
The Human Engineering Research Labs (HERL) at the University of Pittsburgh has partnered with the Indian Spinal Injuries Centre (ISIC) (1) in New Delhi, India, to develop a power wheelchair appropriate for India. To achieve this goal, it is important to study and understand the nature of India’s wheelchair accessibility obstacles.
It is challenging to develop assistive technology to address the varied abilities of individuals in a population, and the difficulty of this task is compounded when direct access to the population is limited. A web application, whose development is described in this paper, is intended to aid the design of a power wheelchair for India by bridging the gap between end users, their living environments, and “experts” through the medium of photographs on the World Wide Web. Approximately five hundred photos taken by 29 ISIC clients (subjects) serve as the source data for the web application.
DESIGN CRITERIA
The web application must be accessible to the general public through the World Wide Web, be secure and anonymous, show a series of images (the source data photographed by the subject) to an “expert” (user), be capable of recording feedback based on those images, allow the user to return to the same spot in the image sequence in a different session of use, allow for intra- and inter-rater reliability tests based on the collected data, and display results of the study in real time (accessible to researchers only).
METHODS
Back-End Architecture
The application was developed on a personal Windows computer running the web server Apache 1.3 (2) and transferred to an IIS 4 server after development. It is written in the programming language PHP (3) and interfaces with a database stored on the web server. During development, we used a MySQL (4) database, but the application is capable of interfacing with a Microsoft Access (5) database using ODBC drivers. Often, coded database queries are tailored to a specific type of database. However, our web application uses the database abstraction scheme ADOdb (6), which allows it to switch between database types at the change of a single line of code. Ultimately, we decided to use MySQL for the study due to MySQL’s greater stability under high-traffic conditions.
User Interface
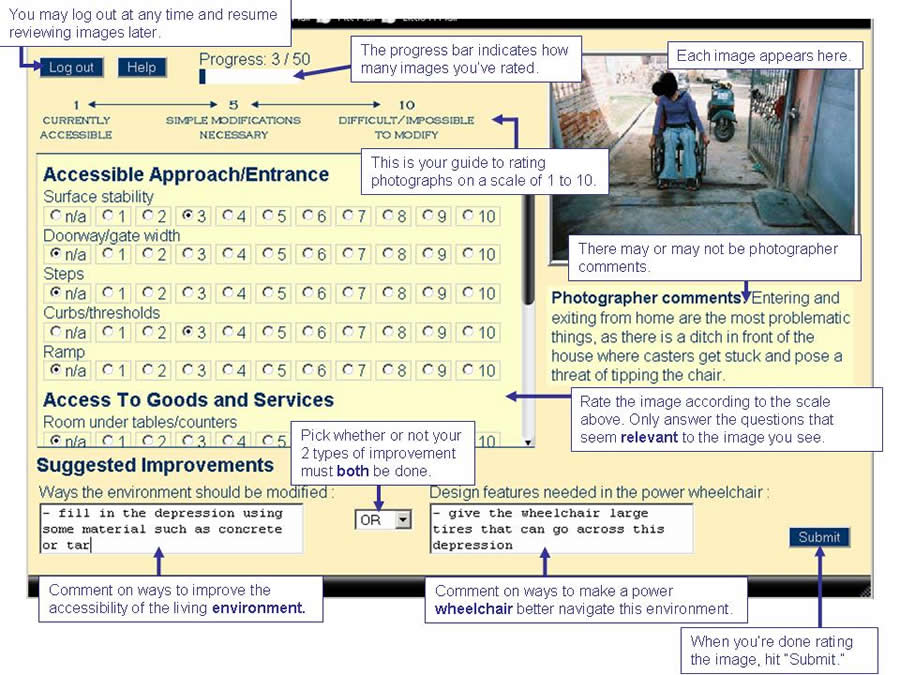 Figure 1: User Interface (Click for larger view)
 A user reads an introduction page that explains the purpose of our study and how to take the questionnaire. The user then registers with non-identifiable demographic information such as gender, age, country, disability (if any), employment status, and familiarity with power wheelchairs and accessibility in developing countries. When the user submits the registration, the sequence of images he will see is generated behind the scenes.
Upon logging in with a unique username/password combination, the user sees one image with a series of bullets and text boxes for him to fill out in response to the image. Figure 1 shows the “help” page from the web application, which is an annotated picture of the user interface.
The user rates accessibility issues on a scale of 1 to 10, where 1 means “completely accessible,” 10 means “completely inaccessible,” and a 5 means that the environment could be made accessible with reasonable modifications such as the addition of a ramp.
The user is instructed not to answer every question, but rather to choose and rate the accessibility features that are portrayed in the photo shown. For example, an image of a flight of steps might merit a response to the “Steps” question only. When the user finishes responding to an image and clicks “Submit,” the second image in the sequence loads. The process continues until the user has seen 50 images in the primary sequence. The user then has a choice whether to continue and rate additional images, which are given in series of 10.
The login name, password, and user’s progress through the image sequence are stored, allowing the user to log out and in at any point to continue the study at a convenient time.
Image Randomization and Repetition
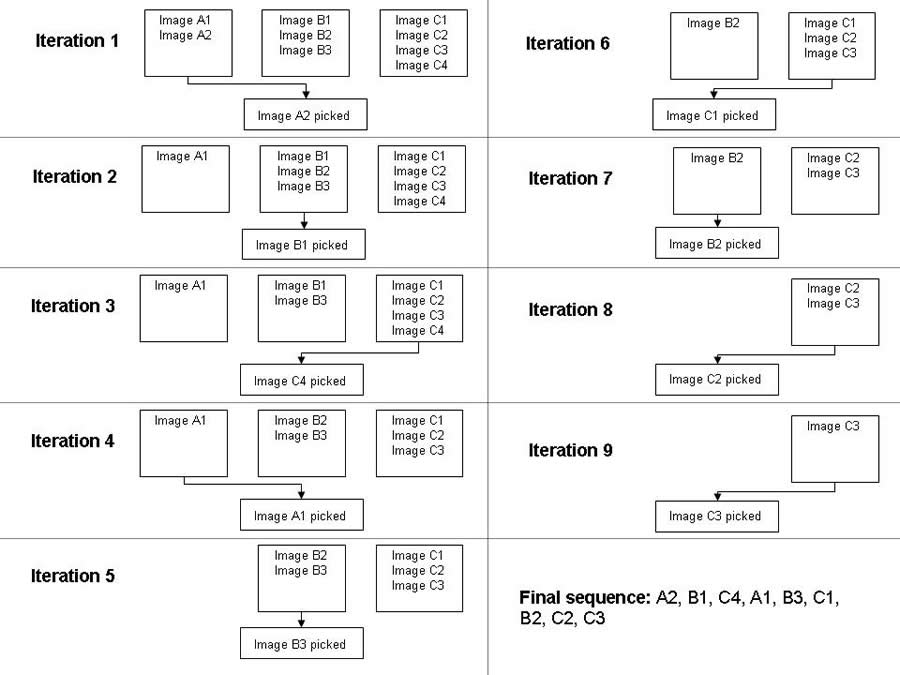 Figure 2: Image Randomization (Click for larger view)
 To display a broad variety of images to our expert users, we constructed a complex randomization scheme to generate each user’s personal sequence. First, the scheme generates a subject sequence—a random list of all the subject identification numbers. Then it generates the user’s unique image sequence using a selection without replacement technique. A random image is drawn from a subject pool, the image number is saved to an array (the image sequence), the image is excised from the pool, and then the process is repeated with the next subject in the subject sequence. If a subject pool runs dry—that is, if all the images from it have been used—that subject is excised from the subject list. Figure 2 is a graphical schematic of the image randomization process.
To test intra-rater reliability, the first three images in each sequence are copied and spliced into the 50 principal images at 15-image intervals. Thus, the user sees (and rates) three images twice. Repeated images are flipped horizontally so that the content of the image remains the same but the user is less likely to realize the image is a repeat.
Additionally, not every user gets a unique sequence; some are repeated so that inter-rater reliability within and across user-selected occupational categories (clinician, engineer, architect, and one who does home modifications) can be computed. A diagram of the repetition scheme can be seen in Table 1.
| Occupation Category | Person 1 | 2 | 3 | 4 | 5 | … | 10 | … |
|---|---|---|---|---|---|---|---|---|
none stated |
s |
s |
u |
u |
s |
u |
s |
u |
Clinician |
s |
s |
u |
u |
s |
u |
s |
u |
Engineer |
s |
s |
u |
u |
s |
u |
s |
u |
Architect |
s |
s |
u |
u |
s |
u |
s |
u |
Home Modifications |
s |
s |
u |
u |
s |
u |
s |
u |
Questionnaire Refinement
Once the first draft of the introduction page and questionnaire were completed, feedback was solicited from five people for refinement of the interface. Feedback was specifically requested regarding the registration process, the appearance of the application, and any usability problems encountered. Comments from this stage prompted us to reduce the number of images shown to the user from 100 to 50.
Program bugs identified by the five pilot users were fixed, and then two of the paper’s authors performed a thorough run through the system for the purpose of evaluating the overall user experience. The authors registered a username and completed the questionnaire from start to finish, commenting on the photos thoughtfully, as though they were truly participating in the study. We discovered that boredom became a problem when the user viewed and responded to 50 images. Rather than further reduce the number of images presented to the user, we weeded out images that provided no information about a home’s accessibility (such as a photograph of a wheelchair against a blank wall). Two wheelchair users judged questionable photos; if there was a consensus that the photograph did not display any accessibility issues, it was removed from the dataset. Twenty-six photos were removed through this process.
RESULTS
We had difficulty getting the Access/ODBC version of the database connection working once the program moved to the IIS server. Permissions and the failure of a web page to close a user session properly were isolated as the cause. The fact that we used the MySQL version of the database to fix the Access version contributed to our decision to use the MySQL version during data collection.
Though several bugs in the PHP code were discovered during development, we believe that the web application is functioning properly now. Feedback has been collected from approximately 30 users. The structure of the web application allows researchers to view results in real time. The researcher logs into a report page and, from there, can view user responses to individual images, averaged user responses, and user comments.
DISCUSSION
We anticipate that the feedback and comments provided by users about images will assist us in the development of a power wheelchair appropriate for India. Interestingly, the anonymous comments system has already proven itself to be a useful tool for the ongoing refinement of the web application itself. User comments have alerted us to server bugs and prompted us to modify the user interface to better accommodate users with small monitors and visual impairments. The internet is a medium through which researchers can have direct, productive contact with users while still maintaining the anonymity required by an exempt IRB protocol.
Though our web application was developed to assist us with a power wheelchair design, we hope that the application can serve as a model for many “user-centered” design projects. In the future, the web-based strategies technology we developed could be applied to the design of other wheelchairs and accessible homes, or serve as a training module.
REFERENCES
- Indian Spinal Injuries Centre. 2006. Visited 26 July, 2006. <http://www.isiconline.org/>.
- Apache HTTP Server Project. 2005. Visited 26 July, 2006. <http://httpd.apache.org/>.
- PHP: Hypertext Preprocessor. 26 July, 2006. Visited 26 July, 2006. <http://www.php.net/>.
- MySQL. 2006. Visited 26 July, 2006. <http://www.mysql.com/>.
- Microsoft Office Online: Access. 2006. Visited 26 July, 2006. <http://office.microsoft.com/en-us/FX010857911033.aspx>.
- Lim, J. ADOdb Database Abstraction Library for PHP (and Python). 2004. Visited 26 July, 2006. <http://adodb.sourceforge.net/>.
ACKNOWLEDGMENT
The research was supported by the National Science Foundation Grant #DGE0333420.
Author Contact Information:
Alexandra Jefferds
jefferdsa@herlpitt.org
412-365-4850
Human Engineering Research Laboratories
VA Healthcare System
7180 Highland Dr. 151R-1
Pittsburgh, PA 15206
Highlights
- Source Ordered
- No Tables
- Very Compatible
Gargoyles
Disney produced a television show in the mid 1990s called Gargoyles. It's a great show and I'm a big fan. A few years ago Disney started to release the show on DVD. The last release was of season 2, volume 1. That was two years ago. Volume 2 has not been released. Why? Poor sales. So if you should find yourself wanting to support my work, instead I ask you pick up a copy of season 2, volume 1. It's a great show and you might find yourself enjoying it.