Web-Based Dynamic Graphing of RSA-911 Rehabilitation Technology Data
Todd D. Schwanke, MSE, Michael J. Brondino, Ph.D., Roger O. Smith, Ph.D., OT, Keith Edyburn
Rehabilitation Research Design & Disability (R2D2) Center
University of Wisconsin-Milwaukee
ABSTRACT
The ATOMS Project is a five year project that investigated the development of a next generation assistive technology (AT) outcomes measurement system. As part of this investigation, the project team examined existing data sources, including the RSA-911 (Case Service Report) data collected by the Rehabilitation Services Administration (RSA) of the United States government. The RSA-911 is an annual compilation of data submitted by state vocational rehabilitation agencies that reports all case closures during a given fiscal year. Each data record (case closure) contains a standardized set of data fields as specified by an RSA policy directive. A few fields contain rehabilitation technology data, which is of interest to the ATOMS Projects, and is defined to include provisions of, rehabilitation engineering, AT devices, and AT services. This paper provides an overview of the web-based, dynamic graphing system that the ATOMS Project developed to display summary data related to rehabilitation technology that was synthesized from the RSA-911 data.
Keywords
Vocational rehabilitation, assistive technology, rehabilitation technology, dynamic graphing, RSA-911
BACKGROUND / Purpose / problem
The RSA-911 database was of interest to the ATOMS Project due to its immense size, standardization across the United States, collection of pre and post intervention data, and its inclusion of rehabilitation technology (RT), which makes it a source of AT outcomes data (1). The RSA-911 report is submitted annually for the preceding fiscal year (FY) by each state’s vocational rehabilitation agency (2,3,4). If the state has a separate agency to specifically serve individuals who are blind, that agency can submit a report with a separate agency code (2, 4). The report contains a record for each case closure that occurred in an agency, regardless of the reason for closure. Therefore, because case closure is the trigger event, it is feasible that a consumer: 1) may not appear in the report in a given year, even though they received VR services during that year or 2) an individual may appear more than once in one year, if their case was closed on two or more separate occasions.
The FY 1997-2001 data specifically indicates whether the individual received, rehabilitation engineering (RE), assistive technology devices (ATD), and/or assistive technology services (ATS) (2). The FY 2002-2004 data does not include the break-down of RT into the three components and instead indicates the general type of vendor/provider and source of funding if RT was provided (3,4). Neither isolates the cost of RT from the total cost of the vocational rehabilitation (VR) services.
As part of a report for the Wisconsin Division of Vocational Rehabilitation (DVR), the ATOMS Project analyzed the RSA-911 data across the states/territories related to RT and then provided a series of graphs to compare Wisconsin to other states. These graphs only represented a small sample of the graphs that could be generated from the data. As a national project, the ATOMS Project believed there would be interest from other states that would like to be able to generate graphs from the data specific to their state in order to see how they compare to other states. Seeing the data could encourage states to investigate and discuss why and how they use RT differently than other states. Generating and making a complete set of static graphs was not seen as feasible for the researchers/developers or end users.
The purpose of this project was to make the synthesized data more accessible than standard print formats and more readily available to everyone by designing a web-based interface so that users could, on demand, generate the graphs they desired as a visualization tool This type of system has obvious accessibility issues, particularly for users with visual disabilities.
METHODs
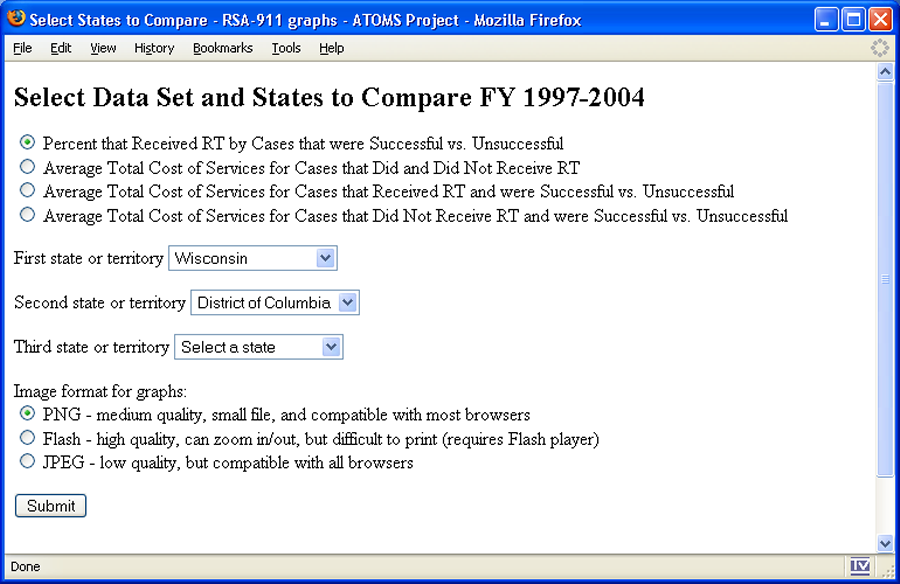 Figure 1: Screen shot of user selection interface d (Click image for larger view)
 The raw RSA-911 data was imported into and analyzed in SPSS and then output to a flat database file to be imported into a web-based database. For simplicity and to reduce the size of graphs, data for states that reported data for more than one program were combined/reported as a single agency. For this initial system, analysis focused on examining the frequency with which RT was provided (overall and specific groups, such as successful vs. unsuccessful) as a part of VR services and what the total costs of services were for these different groups. Additionally, frequencies were calculated for the RE, ATD, and ATS components of RT, when available. National averages were computed for comparison purposes and appeared on graphs as "US". These averages are averages across total population rather than average of the state values
The Adobe (Macromedia) Cold Fusion MX 7 server-based scripting language was chosen for the implementation of the dynamic web-based graphing because it has built-in graphing capabilities and the appropriate server environment was already in place on the UW-Milwaukee campus.
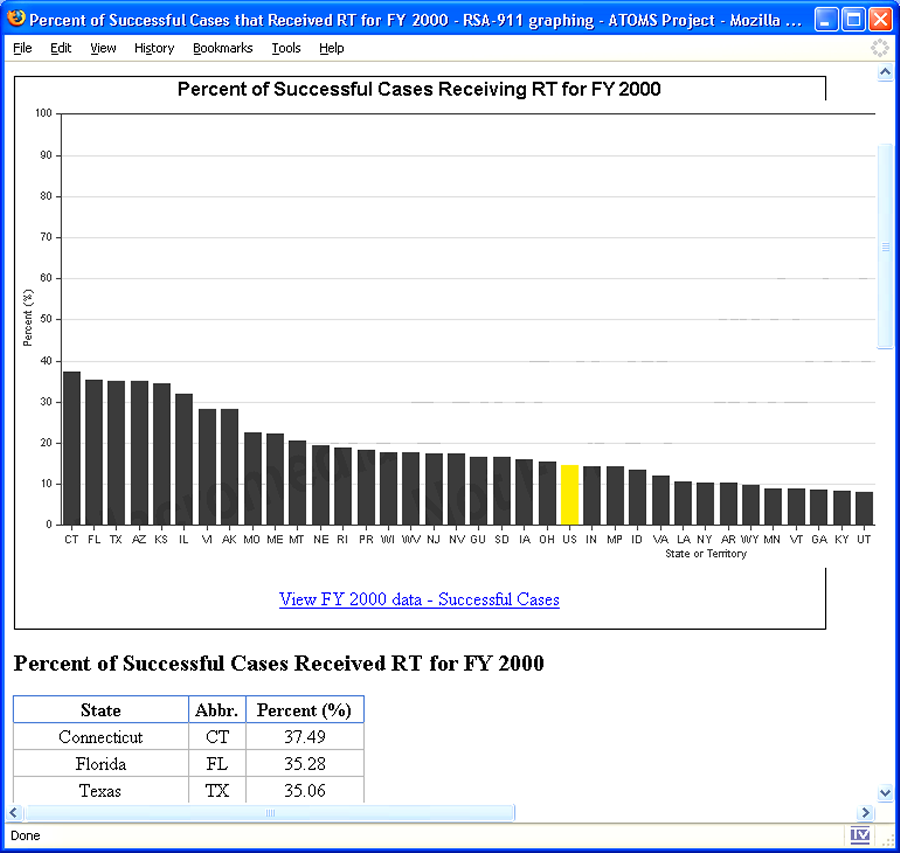 Figure 2: Screen shot of comparing all states for a single year d (Click image for larger view)
 Three major types of graphs were identified and interface pages and results pages were written for each type.
- Comparing all states for a given year on one set of criteria. With over 50 states/territories, these graphs are very wide.
- Comparing up to three states/territories and national averages for FY 1997-2004 for a set of criteria
- Comparing up to three states/territories and national averages for FY1997-2004, specifically for RT, RE, ATD, and ATS.
During the development, three significant limitations were discovered in the Cold Fusion software in terms of accessibility. These included:
- Javascript used in the 'image maps' to display the values of specific data point on the graph are mouse dependent. That is, they cannot be activated with the keyboard.
- The designer cannot designate ALT text to be used for the overall image map that is generated by the server. This makes non-visual navigation with a screenreader more difficult as the graph may not be able to be readily identified.
- The designer cannot set patterns on bar graphs to display information in other than color, so that users who are color blind or who print in black and white can match legends to bars.
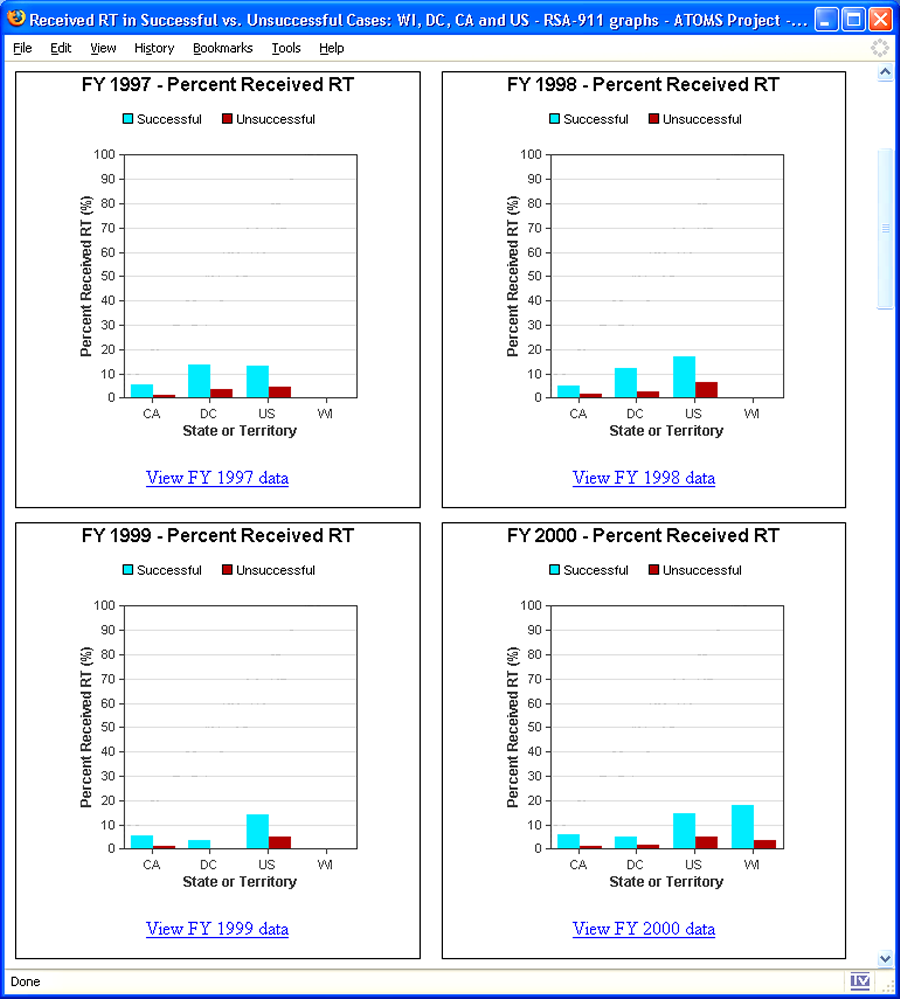 Figure 3: Screen shot of comparing three states for multiple years d (Click image for larger view)
 Given the accessibility challenges in dynamic graphing and the inability to change how the built-in Cold Fusion scripts work, the team went ahead with the Cold Fusion implementation and used innovative solutions to overcome these challenges. Overall, these issues were addressed in part through documentation provided on the web pages that informs the user what to expect and by surrounding the graphs with important context, such as titles in an accessible format. For this reason, the graph title feature provided through Cold Fusion was not used. A link was also inserted below each graph that links the user to a data table that has the data used to generate the graph. Besides allowing someone with a screenreader to navigate the data, this also provides a mechanism for users to export a portion of the data to graph in their preferred graphing program.
The color issue was partially addressed by using a set pattern of light, medium and dark color bars that could be discriminated even in black and what. Additionally, close attention was given to ensuring that the graphs and their legends used consistent ordering, particularly when more than three colors were needed.
In graphing the data, the decision was made to keep the FY 1997-2001 data separate from FY 2002-2004, rather than trying to longitudinally connect them, due to the change of policy directives that controls how RT data was reported (2,4).
RESULTS
The graphing system is now available at www.atoms.uwm.edu/rsa-911/. Five screen shots with text descriptions are included below to demonstrate the user interface and output of this system.
DISCUSSION / CONCLUSION
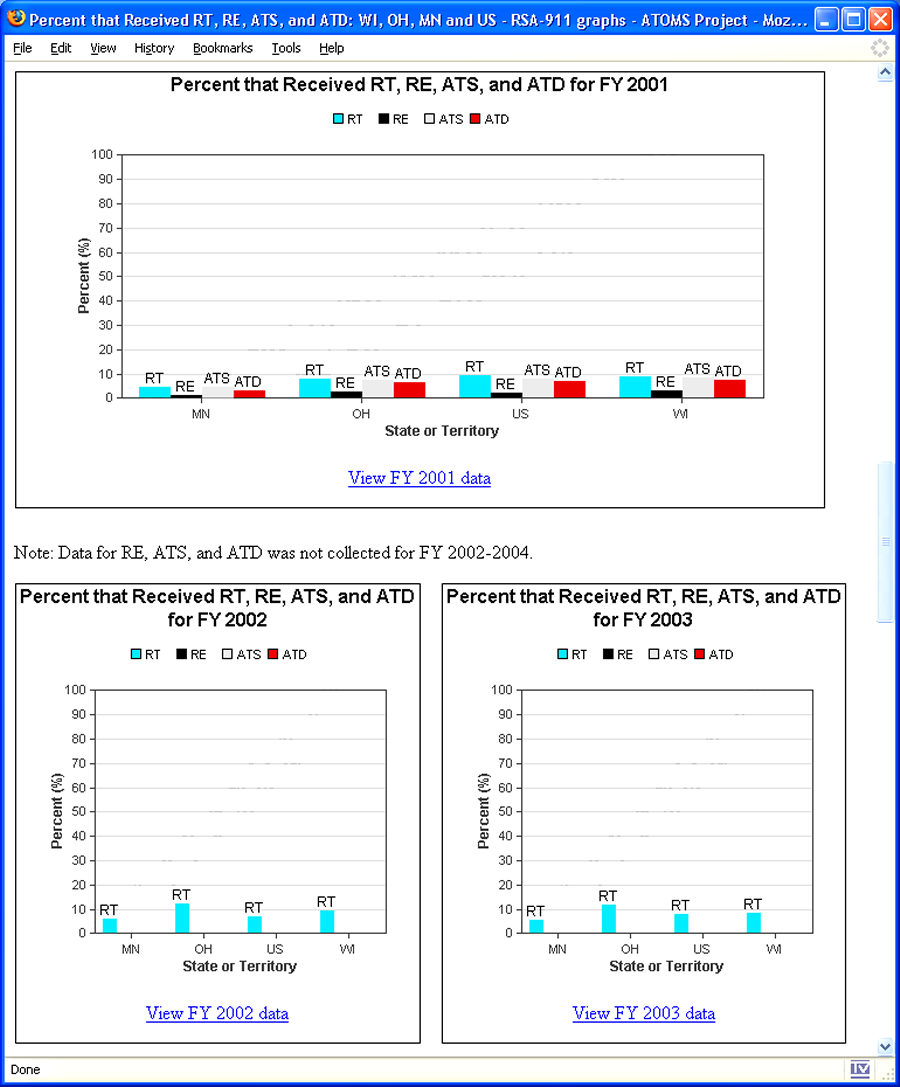 Figure 4 : Screen shot of comparing RT components for three states d (Click image for larger view)
 This system for dynamically graphing the annual, national RSA-911 data provides proof of concept and a useful visualizing tool for all states to make some comparisons related to RT. While the system is not currently 100% accessible, as the Project prefers that it would be, steps have been taken in the design to help ensure that the widest population possible is able to access and use the system. The Project team plans to contact Adobe to suggest that the accessibility problems encountered be addressed in the next release of the product.
The graphs are primarily based on descriptive statistics related to RT from the RSA-911 dataset. Despite the size of the data set, the ability to draw conclusions about the outcomes of RT from these graphs is limited. The graphs only show what RT provision was reported by the state/territories agencies. The RSA-911 data and these graphs do not take into account RT/AT that consumers may have received prior to or outside of their VR program, such as through medical channels, from an employer, or purchased out-of-pocket, etc.
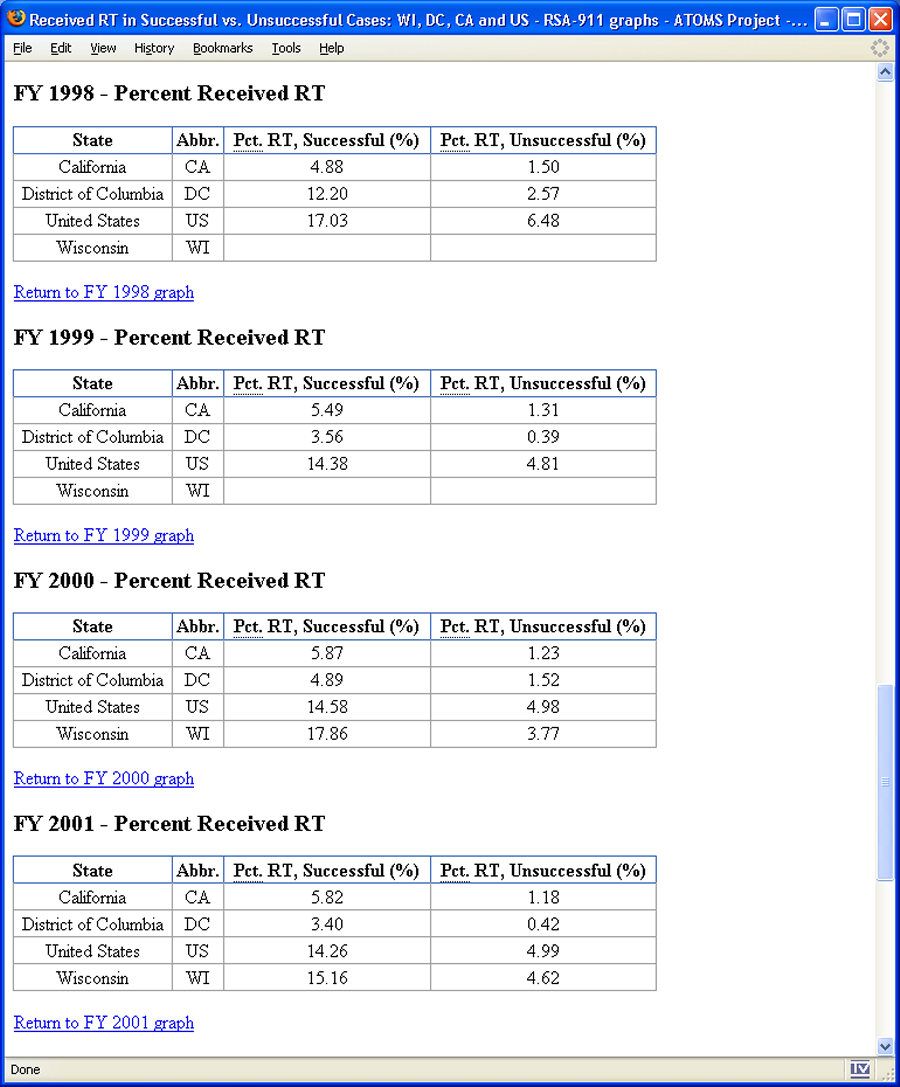 Figure 5: Screen shot of data table d (Click image for larger view)
 The system will be first promoted in Wisconsin for use by VR counselors and administrators. After changes are made based on feedback, the system will be promoted nationally. Ideally, the ATOMS Project would like to be able to process the full set of data more in-depth (e.g. correlations) and graph it on demand. With about 600,000 records annually, this is a difficult task, but will be considered for future versions of the graphing system. Future work should include more hypothesis driven correlation studies to determine more about the relationships and predictors in this large data set. These studies could also be represented in graphs similar to those demonstrated in this paper.
REFERENCES
- Schwanke, T. D. & Smith, R. O. (2004). Introduction to assistive technology data in the RSA-911 case service report for application to assistive technology outcomes measurement. Proceedings of the RESNA 27th International Conference on Technology and Disability: Research, Design, Practice and Policy.
- U.S. Department of Education, Rehabilitation Services Administration (RSA) (1995, May 1), RSA-PD-95-04, Announcement of OMB approval for Collection of Data in the Case Service Report (RSA-911).
- U.S. Department of Education, Rehabilitation Services Administration (RSA) (2000, March 16), RSA-PD-00-06, Announcement of OMB approval for Case Service Report (RSA-911), OMB Number 1820-0508.
- U.S. Department of Education, Rehabilitation Services Administration (RSA) (2000, April 17), RSA-PD-00-07, Amendment of RSA-PD-00-06, dated March 16, 2000: Announcement of OMB approval for Case Service Report (RSA-911), OMB Number 1820-0508.
ACKNOWLEDGMENTS
The ATOMS Project is supported in part by the National Institute on Disability and Rehabilitation Research, grant number H133A010403. The opinions contained in this paper are those of the grantee and do not necessarily reflect those of the NIDRR and the U.S. Department of Education.
This work was also supported in part through a contract with the Wisconsin Division of Vocational Rehabilitation. The opinions contained in this paper are those of the contractor and do not necessarily reflect those of the Wisconsin Division of Vocational Rehabilitation.
Author Contact Information:
Todd Schwanke, MSE
UW-Milwaukee
R2D2 Center END135
PO Box 413
Milwaukee, WI 53201
Voice (414) 229-6803
TTY (414) 229-5628
Email r2d2@uwm.edu
Project website www.atoms.uwm.edu
Center website www.r2d2.uwm.ed
Highlights
- Source Ordered
- No Tables
- Very Compatible
Gargoyles
Disney produced a television show in the mid 1990s called Gargoyles. It's a great show and I'm a big fan. A few years ago Disney started to release the show on DVD. The last release was of season 2, volume 1. That was two years ago. Volume 2 has not been released. Why? Poor sales. So if you should find yourself wanting to support my work, instead I ask you pick up a copy of season 2, volume 1. It's a great show and you might find yourself enjoying it.