Effects of Suspension on the Vibrations Experienced during Wheelchair Propulsion
Maneekobkunwong Somboon, MSME
ABSTRACT
Exposure to shocks and vibrations is a growing concern to the mobility and function of wheelchair users. The purpose of this study was to determine the influence of front caster and rear wheel suspension on seat forces and head accelerations experienced by individuals during overground wheelchair propulsion with a rigid frame wheelchair and 3 rear wheel suspension frame wheelchairs. We hypothesized that the front caster and rear wheel suspension system will reduce the vibration experienced by individuals propelling over the test track.
Keywords:
wheelchair vibration, suspension system, force and accelerations, spinal cord injury,
BACKGROUND:
For many persons with a spinal cord injury (SCI), the most common method of mobility is a wheelchair. Exposure to excessive shocks and vibration has been linked to back [1; 2]} and neck [3]} pain. It is also suspected that the added loads of a harsh ride can contribute to muscle fatigue [4]}. To improve the ride, manufacturers developed designs using innovative caster, frames, and suspension systems to reduce shocks and vibration. Therefore, knowledge of the forces and accelerations experienced by the rider is important for understanding the benefits these suspension chairs provide. The goal of this paper is to quantify the vibration experienced by manual wheelchair users and to determine if suspension can reduce the forces through the rider during riding, including wheelchair propulsion.
METHODOLOGY:
The methodology of our current study is to simulate the wheelchair testing in the real world propulsion and measure the forces and accelerations acting on the rider when the subjects traversed a test course. Each subject propelled the instrumented chair through the test course with self-selected speed. Mobile data collection system was used to collect data along the propulsion. Time and frequency domain analysis was performed to examine the forces and accelerations experienced by the riders. The time domain analysis will show the absolute force and acceleration experienced by the rider. The frequency domain analysis brakes down the force and acceleration into their frequency content, and allows us to compare the results in the frequency range that is most harmful or uncomfortable to people.
Subjects:
Four adult men with complete motor tetraplegia (n=2) and paraplegia (n=2) agreed to participate. They were recruited from the outpatient clinic at Rancho Los Amigos National Rehabilitation Center. Prior to data collection, each subject was provided with a copy of the Bill of Rights of Human Subjects and was asked to read and sign an informed consent form that had been approved by the Rancho Los Amigos Institutional Review Board. All testing was performed at the Rehabilitation Engineering in Rancho Los Amigos National Rehabilitation Center.
Instrumented Wheelchairs:
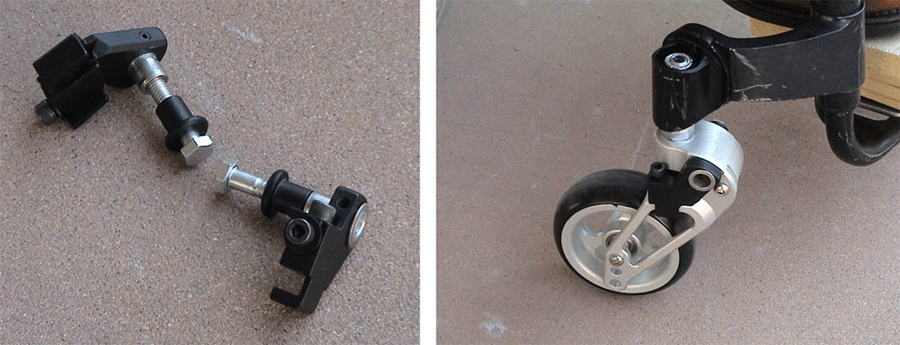 Figure 1. (Click image for larger view)
 One rigid (Quickie GPV) frame and (three) suspension (Colours Boing, Invacare A4, and Quickie XTR) frame wheelchairs were instrumented with load cells (MLP Series, Transducer Techniques)[5]. All chairs are equipped with Frog-Leg casters, and locking device (Figure 1). The seat frames were suspended with seven-load cells on all chairs to collect force components (x,y,z) acting on the rider through the seat and backrest (Figure 2). To collect acceleration, two-axis accelerometers were placed on a bicycle helmet worn by the test participant, on the seat frame, on the axle close to the rear wheel hub, and on the top of the caster. This setup provided information of the disturbances entering the chair through the caster and wheel hub, reaching the seat, and finally reaching the rider. The bicycle speedometer was used to collect the velocity through a data acquisition system.
Data Acquisition System:
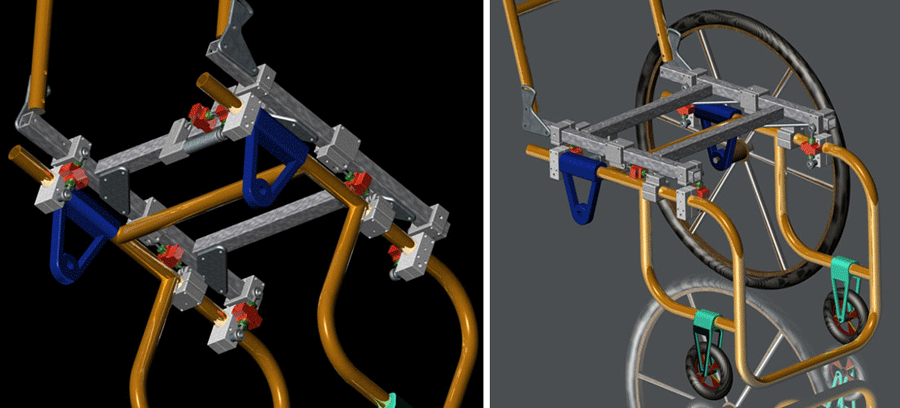 Figure 2. (Click image for larger view)
 The data was collected using a laptop computer equipped with two data acquisition cards to collect 16 differential channels. A rechargeable battery pack and a DC voltage regulator provided the power source. The amplification of the signal was done by the PCMCIA cards, and the data was filtered digitally. The data acquisition system was placed on a cart allowing the tester to follow the subject’s chair through the test course (Figure 3).
Data Collection:
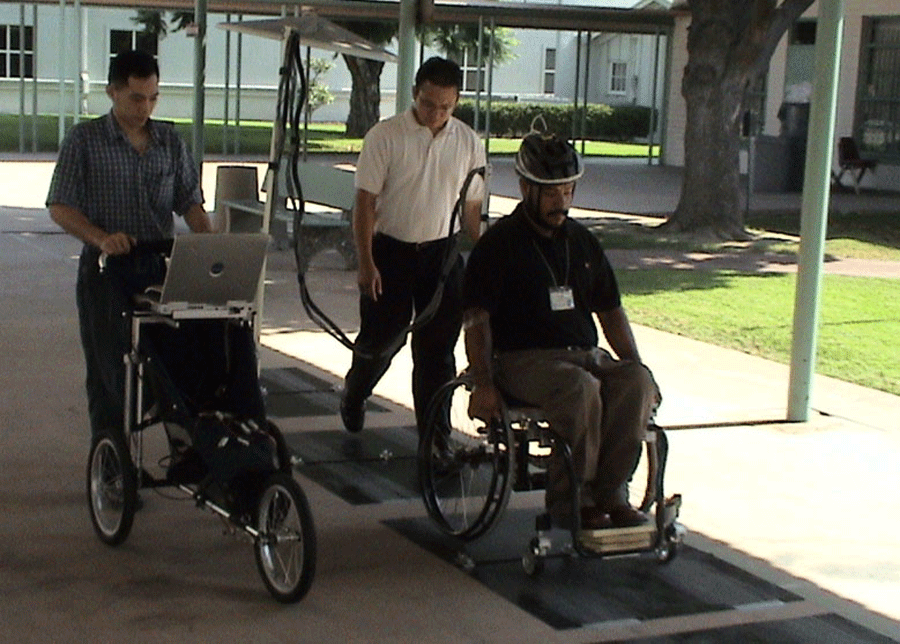 Figure 3. (Click image for larger view)
 Weight, age, level of injury of the subject were recorded. Subjects propelled at a self-selected speed over multiple ½ -inch diameter aluminum rods evenly spaced (56.5”) across a test track. Therapist also pushed the subject over the same obstacles with the same constant speed as the speed during self-propulsion. To determine the effect of front wheel suspension on seat forces, a locking device was used to disable (Locked) or enable (Unlocked) the front caster (Frog Legs) suspension fork. This allowed measurement of the effects of caster suspension in addition to comparing the performance of different suspension designs to the rigid chair.
Data Analysis:
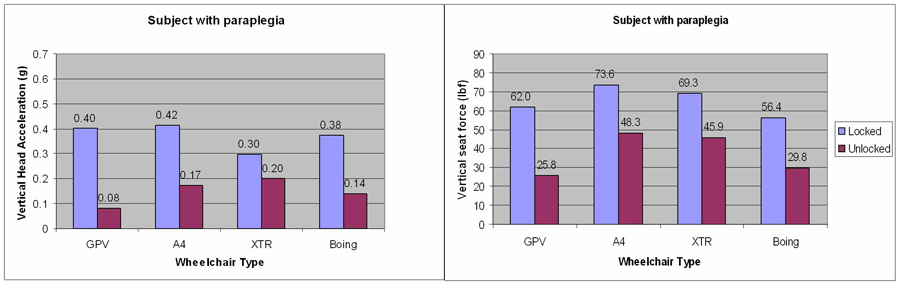 Figure 4. (Click image for larger view)
 During the test sessions the data was collected as text files. The data was converted into force and acceleration values and filtered for analysis in time domain and frequency domain. Previously the data collected through controlled laboratory conditions was consistent enough to allow for time domain comparison [5; 6], optimistically, in the real world driving would provide attainable data in order to complete the analysis in time domain. In addition, frequency domain analysis[7; 8] was used to evaluate the data, beside that the frequency content of the disturbance acting on a body is important since disturbance within certain frequency range tend to reside in the range of frequencies most sensitive, harmful, and uncomfortable to humans during whole-body vibration in the range between 4-10 Hz. [9]. The power spectral density (PSD) of the force and acceleration data was calculated using the Welch's method, and incorporated the use of a frequency weighing function used by ISO 2631 (1997) [10] which amplifies the magnitude of the PSD signal at harmful and uncomfortable frequencies during whole-body vibration, and reduces the magnitude of the PSD at frequencies that are not critical. The frequency analysis approach would direct the comparison of data from different chairs that might respond at different frequencies [11]. To further simplify the comparison of the data, the PSD data is separated into 0.5 Hz intervals and the peak value of each segment is retrieved, this results to simple charts for comparing the performance of different chairs and the effect of frog legs.
|
Tetraplegia (n=1) | Paraplegia (n=1) |
||
|---|---|---|---|---|
| % Decrease over Locked | % Decrease over Locked | |||
| Chair Type | Force | Accel. | Force | Accel. |
| GPV | 75.2 |
38.8 |
58.4 |
79.3 |
| A4 | 41.2 |
51.4 |
34.4 |
58.1 |
| XTR | 40.3 |
13.2 |
33.7 |
32.0 |
| Boing | 30.8 |
27.7 |
47.1 |
62.9 |
RESULTS
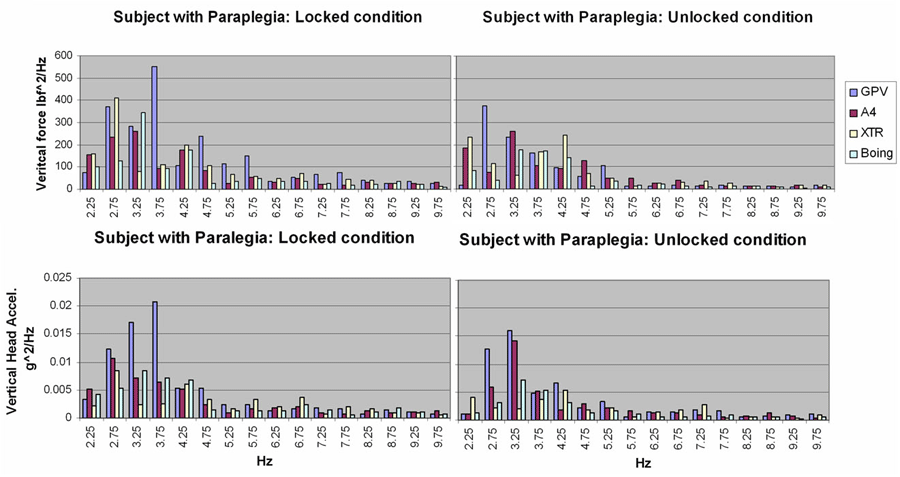 Figure 5. (Click image for larger view)
 The data collected from the testing was analyzed in time and frequency domain. Currently we only analyzed the vertical seat force acting on the rider and the vertical head acceleration experienced by the rider, since we feel these are the most critical of the measured data. In time domain analysis, the maximum force and acceleration experienced by a subject from each of the eight bumps was averaged. This was done for each subject, in each chair, with the casters locked and unlocked. When comparing the data between the locked and unlocked caster conditions between the different chairs, it was apparent that the unlocked casters resulted in reduced forces and accelerations. For example Figure 4 shows the data for Subject 2, the vertical seat force compared between the unlocked and locked casters resulted in a reduction of 58% in the GPV, 34% in A4, 33% in the XTR and 47% in the Boing. For the averaged peak head acceleration compared between unlocked and locked casters there was a reduction of 79% in the GPV, 58% in the A4, 32% in the XTR, and 62% in the Boing. However, when comparing the different chairs with the front casters in the same configuration across the different subjects, the data was inconsistent. No single chair stood out as the one with the highest or lowest resulting forces and accelerations.
In frequency domain analysis, when looking at the PSD of the data from Subject 2 (Figure 5), there are some consistent differences between the response from the different chairs and with the different caster configurations. The rigid chair always had the highest amplitude, but the amplitude of the three suspension chairs varied. In general PSD amplitude of the force and acceleration measured from all the chairs decreased when the casters were unlocked. However these differences were not consistently observed for all the subjects
DISCUSSION
This was our preliminary effort in testing subjects in a realistic setting and analyzing the data in frequency domain. The reasoning behind the testing was to give the subjects complete freedom in the way they managed the obstacles. We were aware of the fact that the data would be very inconsistent to be practically analyzed in time domain. However we were hopeful the PSD approach would reveal consistent differences between the chair and the two caster configurations. From the testing and data analyses we realized that the there were too many variables and the data in general did not show much consistency, even in frequency domain. For example the speed at which the same subject would push the different chairs would vary greatly; even with the same chair the subjects would change the speed from one obstacle to the other. Also the subjects would overtake the obstacles in different manner, sometimes hitting them straight on, sometimes popping a wheelie and sometimes hitting them at an angle. The lessons learned from these set of tests will be applied in the following tests to generate more meaningful data. Most likely the subjects will be instructed to push the chairs at a predetermined speed and to overtake the obstacles in a consistent manner.
REFERENCES
- Pope, M. H., D. G. Wilder and M. L. Magnusson (1999). "A review of studies on seated whole body vibration and low back pain." Proc Inst Mech Eng [H] 213(6): 435-46.
- Pope, M. H. and T. H. Hansson (1992). "Vibration of the spine and low back pain." Clin Orthop Relat Res(279): 49-59.
- Boninger, M. L., et al. (2003). "Investigating neck pain in wheelchair users." Am J Phys Med Rehabil 82(3): 197-202.
- Zimmermann, C. L., T. M. Cook and V. K. Goel (1993). "Effects of seated posture on erector spinae EMG activity during whole body vibration." Ergonomics 36(6): 667-75.
- Kerdanyan, G., et al. (2005). Measurement of Force and Acceleration Experienced in a Manual Wheelchair. RESNA 28th Annual Conference, Atlanta, GA.
- Kerdanyan, G., et al. (2006). The effects of wheelchair vibration as a function of wheelchair suspension, trunk muscle innervation, and velocity. Journal of Spinal Cord Medicine, Boston, MA.
- Wolf, E. J., et al. (2004). "Using the absorbed power method to evaluate effectiveness of vibration absorption of selected seat cushions during manual wheelchair propulsion." Med Eng Phys 26(9): 799-806.
- VanSickle, D. P., et al. (2001). "Analysis of vibrations induced during wheelchair propulsion." J Rehabil Res Dev 38(4): 409-21.
- Griffin, M. J. (2004). Handbook of Human Vibration. San Diego, CA, Elsevier.
- Mansfield, N. J. (2004). Human Response to Vibration. London, UK, Taylor and Francis.
- Cooper, R. A., et al. (2003). "Seat and footrest shocks and vibrations in manual wheelchairs with and without suspension." Arch Phys Med Rehabil 84(1): 96-102.
ACKNOWLEDGEMENTS:
NIDRR grant H133E020732, Sunrise Medical (Quickie GPV®, XTR®), Colours (Boing®), Invacare (A4)
Contact Information:
Maneekobkunwong Somboon, MSME
Los Amigos Research and Education Institute
7601 E. Imperial Hwy.
Downey,CA. 90242
562-401-7994
noom@ranchorep.org
Highlights
- Source Ordered
- No Tables
- Very Compatible
Gargoyles
Disney produced a television show in the mid 1990s called Gargoyles. It's a great show and I'm a big fan. A few years ago Disney started to release the show on DVD. The last release was of season 2, volume 1. That was two years ago. Volume 2 has not been released. Why? Poor sales. So if you should find yourself wanting to support my work, instead I ask you pick up a copy of season 2, volume 1. It's a great show and you might find yourself enjoying it.