Methodology to Measure the Adjustability of Skin Protection Features of Wheelchair Cushions
Maureen Linden, MSBME; Stephen Sprigle, PH.D., MSPT
Center for Assistive and Environmental Access, Georgia Institute
of Technology
ABSTRACT
Adjustable skin protection wheelchair cushions have the capacity to accommodate a variety of body types and masses. Little information exists about how the characteristics and performance of adjustable versus non-adjustable wheelchair cushions differ. This project develops a test methodology to distinguish performance based on envelopment, immersion, and magnitude constructs. The protocol uses two models based on human anthropometry at different loads and examines variations between cushion types. Some constructs show repeatability and statistical significance based on model, load, and cushion type. Additional work is needed to validate the protocol and determine the best method of cushion adjustment and metric selection.
KEYWORDS
cushions, testing, adjustability
BACKGROUND
The Center for Medicare & Medicaid Services (CMS) categorizes wheelchair cushions based on their performance characteristics as they relate to skin protection and postural support. With the Statistical Analysis Durable Medical Equipment Regional Carrier (SADMERC), CMS develop codes and performance requirements for general use, skin protection, positioning, and skin protection and positioning wheelchair cushions. In 2004, these agencies determined that these codes alone did not adequately describe the characteristics for wheelchair cushions adjustable with respect to their provision of skin protection. An adjustable skin protection code was defined for cushions that had the required characteristics for skin protection, and also was adjustable by the addition or removal of air, liquid, gel, or other fluid medium in physiologically appropriate areas of the cushion to promote pressure reduction. (1)
This broad definition does little to define the characteristics and performance of adjustable versus non-adjustable pressure relieving cushions. Cochran identified envelopment, immersion, and magnitude as constructs describing the mechanical behavior of wheelchair cushions. Envelopment refers to cushion’s ability to equalize pressure about the surface of the person loading it. It helps reduce pressure gradients. Immersion, or load-indentation, indicates the relative stiffness of the cushion. This factor affects the depth to which the object will sink into the support surface of the cushion. Finally, magnitude, as measured by the interface pressure, is the clinical manner by which cushion effectiveness is judged (2). Cochran’s work forms the basis of standards that are being developed through ANSI/RESNA on wheelchair cushion performance, and others have used these characteristics to quantify the performance of cushion materials and designs (3,4,5,6,7)
The purpose of this project is to develop a test methodology to distinguish the load distribution characteristics of adjustable and non-adjustable wheelchair cushions.
APPROACH
Adjustable wheelchair cushions are those which provide clinically appropriate load distribution characteristics for a variety of body types and masses. This protocol uses two models based on the anthropometry of the pelvis to represent body types. These models are loaded on the cushion at two masses to complete the test matrix described below.
| Model A | Model B | |
|---|---|---|
| High Load | ||
| Low Load |
Model A and B are based on the anthropometry of the ischial tuberosities (ITs) and trochanters, the skeletal structures that bear load in seating (Figure 1). The models utilize spheres of different radii to simulate the pelvic structure. The most inferior points of the spheres represent the ITs and are set 11 mm apart. The spheres are mounted to an arm with prominences spaced at the average bi-trochanteric distance. The trochanters are set 4 cm superiorly to the ITs, again reflecting anatomic averages.
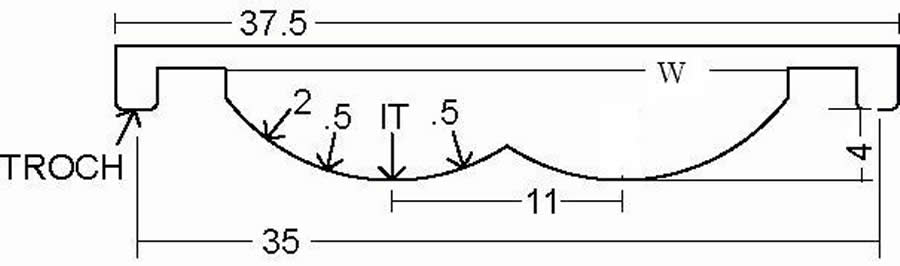 Figure 1. (Click image for larger view)
 The international average mass of humans is 70 kg. The high and low loads used in this protocol represent the endpoints of a range of +/- 20% of the average body mass, thus representing a 56 kg and 84 kg individual. Since the models represent the pelvis only, the mass loaded through these models consists of the anthropometric weights of the head, upper extremities, trunk and pelvis.
Preliminary testing also investigated the effect of soft tissue mass simulated by adding gel layers between the model and the cushion. Pressures were measured with 0,1, and 2 ½” gel pads. Test results after t-test analysis indicated these gel layers did not alter the results, and these gel layers were not included in the protocol (P>0.55).Pressure sensors (Micromovements, TD series transducers, Eversley, UK) were placed across the coronal mid-line of the model to characterize load distributions across the model surface. Sensors were placed unilaterally at the ITs (sensor IT) and trochanters (sensor 4), and points on the sphere superior to the ITs by 0.5 cm medially and laterally (sensors -0.5 and +0.5) and 2cm laterally (sensor 2). Pressure sensor locations are depicted by the arrows shown in Figure 1. The pressure sensors were selected for their usability, repeatability, and ability to withstand off-axis loading as required by the cushion-buttock interface environment.
Metrics
Metrics were defined using the individual pressure sensors for the three constructs of load distribution: envelopment, immersion, magnitude. It is theorized that a perfectly adjustable cushion will report a similar response within the test matrix in Table 1. A variety of metrics were investigated to represent the constructs of load distribution. Table 2 shows a summary of the metrics which had the best repeatability and statistical significance in preliminary testing.
Metrics for test cushions are all reported relative to flat foam. Data is collected on the test matrix for the foam sample, and for the test cushion with all of its adjustments within the same test session. Reference cushion data is used to create performance measures relative to the flat foam, thereby increasing the validity of the methodology and facilitating its expansion to multiple labs.
For preliminary analysis, metrics were calculated for each of three test runs and with a data set consisting of the median of each sensor pressure (metrics_median). Metrics for each trial were compared to the metric_median. In only 4% of the cases was the metric_median more than 1% different from the metric for the trial that contained the median IT pressure value (metric_IT). These cases consisted of metrics characterizing magnitude calculations with most of the sensors. For the cases with greater differences, the average difference between metric_median and metric_IT was 5%. Because of these small differences, it was determined that the analysis would be carried out on the trial that contained the median IT pressure, since this represented an actual data sample rather than an artificial sample.
| Metric | Measures | Description |
|---|---|---|
| Total: -0.5 to +0.5 | Magnitude | The sum of the pressures of sensors -0.5, IT, and +0.5 |
| Total: IT to 2 | Magnitude | The sum of the pressures of sensors IT, +0.5 and 2. |
| %IT centrally | Envelopment/Magnitude | % of the IT load compared to the 3 inferior values. Helps discern off-loading of the IT |
| %IT laterally | Envelopment/Magnitude | % of the IT value compared to the sum of the 3 most medial sensors. Helps discern off-loading of the IT. |
| dispersion | Envelopment | The sum of the differences between the IT, -0.5 and +0.5 and the average of these 3 sensors. |
| Trochanter contact | Immersion | A binary metric that determines if the model has sunk into the cushion as far as the trochanters. Trochanter contact is 1 if the height above the cushion surface following the test is at least 40 mm below the support surface thickness. This approach is analogous to the loaded contour depth tests required by SADMERC (3). Attempts to use the pressure sensor to determine contact failed because of idiosyncrasies with cushion designs – i.e. the presence of gel or air bladder seams – creating false negatives. |
Protocol
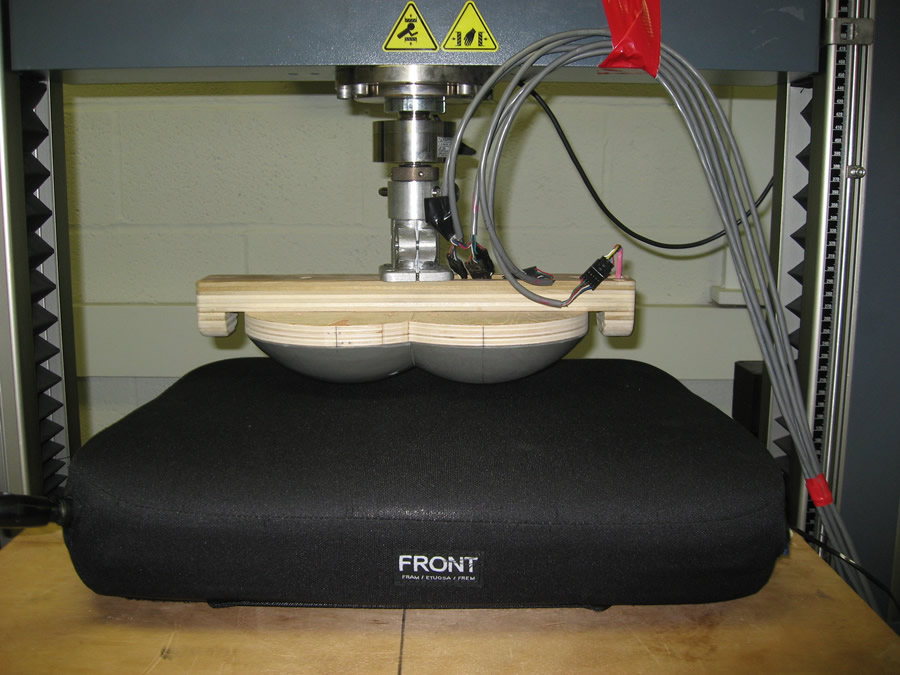 Figure 2. (Click image for larger view)
 The support surface thickness for each cushion to be tested is measured in accordance with the protocol detailed by ANSI/RESNA (3). A material test system (Zwick/Roell, Z005, Alpharetta, GA) is used to apply loads to a cushion surface through the developed models. The cushion is placed on a support surface mounted in the material testing frame such that the ITs of the model fall 13 cm from the rear of the cushion. Figure 2 shows Model B loaded in the test frame with a test cushion.
Following 3 pre-conditioning cycles, the cushion is tested by according to the testing matrix, applying loads and models. The pressure values at each sensor and the height of the ITs above the support surface are recorded after the load is held for two minutes. Three measures are taken at each condition. Data is collected on a reference cushion for comparison purposes. The reference cushion is 18” x 18” x 3” piece of HR45 foam. Reference cushion data is used to create performance measurement relative to flat foam, thereby increasing validity and ability to compare tests from other laboratories.
RESULTS
A data set including multiple reference cushion samples has been collected. Table 3 shows the results of raw metric values for dispersion (envelopment) and Total IT to 2 (magnitude). These metrics were chosen for demonstration because they were repeatable over between day measurement and showed statistically significant differences by weight and model factors when investigated on the reference foam. Additionally, when investigated on a small cohort of cushions, values from non-adjustable cushions were significantly different from values from adjustable cushions. Table 4 summarizes significance for the repeatable metrics investigated.
| Envelopment (dispersion) | Magnitude (Total -0.5 to 0.5) | |||
|---|---|---|---|---|
| Model A | Model B | Model A | Model B | |
| High Load | 233 | 395 | 672 | 843 |
| Low Load | 57 | 125 | 389 | 392 |
Table 5 shows sample data from two cushions tested in the preliminary cohort. Note that these metrics are reported relative to the metric of the reference cushion data taken on the same day and are thus expressed with relation to the performance of foam.
| Factors | |||
|---|---|---|---|
| Metric | weight | model | cushion type |
| dispersion | 0.01 | 0.01 | 0.05 |
| %IT central | 0.01 | 0.05 | |
| %IT lateral | 0.01 | ||
| Total: -0.5 to +0.5 | 0.01 | 0.01 | |
| Total: IT to +2 | 0.01 | ||
For the envelopment metric, the adjustable cushion shows a much smaller range of values across models and masses than the non-adjustable cushion. This indicates that the cushion accommodates better to the different loads and model designs. Further, the range of values is lower, indicating better envelopment.
The non-adjustable cushion has a smaller magnitude range than the adjustable cushion, but its value is near or grater than 1. This indicates that the pressure magnitude is equal to or greater than that measured on the reference foam. The adjustable cushion has a broader magnitude range, reports pressure magnitudes that are 40-72% that of foam.
| Envelopment (dispersion) | Magnitude (Total: -0.5 to 0.5) |
||||
|---|---|---|---|---|---|
| Model A | Model B | Model A | Model B | ||
| Viscoelastic Gel (adjustable) | High Load | 0.15 |
0.10 |
0.58 |
0.40 |
| Low Load | 0.46 |
0.10 |
0.72 |
0.58 |
|
| Viscoelastic Foam (Non-Adjustable ) | High Load | 0.39 |
0.29 |
0.99 |
0.98 |
| Low Load | 1.03 |
0.67 |
1.21 |
1.20 |
|
The immersion metric, trochanteric contact, is a binary value based on the same principles as the loaded contour depth measurement described by SADMERC. For the cushions discussed in Table 3 and 5, this metric was constant at 1. This has been the case for the majority of adjustable cushions in the cohort. However, some non-adjustable cushions have not shown trochanteric contact. Nonetheless, this lack of sensitivity in the immersion measurement is a concern.
DISCUSSION
The described test protocol seeks to identify cushions that can accommodate different body weights and body types. While other parameters exist and were considered, these two appear to provide a fair basis upon which to determine adjustability.
One difficulty in this protocol involves the adjustment of each cushion for model and load. Some cushions have discrete, finite adjustments. For example, a viscoelastic gel cushion may be adjusted by removing gel bladders. Others, such as air bladders, have a nearly infinite amount of adjustment through the release of a volume of air. Every attempt was made to adjust the cushion according to manufacturer’s specifications, which, while clinically appropriate, may not apply to a bench test with a model buttocks. Adjustment of the cushion to best demonstrate one construct, may have a detrimental effect on another. For example, adjusting a cushion to maximize immersion, may result in increasing the magnitude of the pressures under the ITs and trochanters.
Selection of the appropriate metric to report, can also be difficult. Again, this relates to cushion adjustability. Testing a cushion that offers 3 finite adjustments (e.g., 3 different gel bladders) requires 12 tests (3 test matrices). Selection of the “best” of each metric may result in over-reporting the performance of the cushion, particularly if optimal envelopment and magnitude do not reside within the same adjustment setting. More investigation is necessary to select the metric value that best reflects the performance of the cushion.
Further research in this area will involve completion of testing on a cushion cohort that reflects all cushion materials available, as well as a range of adjustable and non-adjustable cushions. Validation of the protocol in multiple laboratories is also necessary. A means of scoring the metrics based need to be developed. Classification of cushions as adjustable and non-adjustable based on a threshold score will be attempted.
REFERENCES:
- DMERC Region C “Wheelchair Seating: Coding and Pricing Changes.” Medicare Advisory 51(Winter 2004): 169-170.
- Cochran G, Palmieri V “Development of Test Methods for Evaluation of Wheelchair Cushions.” Bulletin of Prosthetics Research 17(1): 9-30.
- ANSI/RESNA Subcommittee on Wheelchair Seating Standards, Wheelchair Seating-Part 2: Test methods for devices that manage tissue integrity – Seat Cushions, ISO 16840-2.
- Sprigle S, Dunlop W, Press L, Reliability of bench tests of interface pressure. Assistive Technology, 2003; 15:49-576, Summer.
- Sprigle S, Press L. Reliability of the ISO wheelchair cushion test for loaded contour depth. Assistive Technology, 2003; 15:145-150, Winter.
- Sprigle S, Chung KC, Brubaker CE. Reduction of sitting pressures with custom contoured cushions. J Rehabil Res Dev. 1990 Spring;27(2):135-40.
- Sprigle S, Press L, Davis K. Development of uniform terminology and procedures to describe wheelchair cushion characteristics. J Reabil Res Dev 2001 July/August; 38(4): 449-61.
ACKNOWLEDGEMENTS
This research has been made possible by the Mobility Rehabilitation Engineering Research Center funded by National Institute on Disability Research and Rehabilitation.
Maureen A. Linden, MSBME
CATEA – Georgia Institute of Technology
490 10th Street
Atlanta, GA 30332
404-894-908
Highlights
- Source Ordered
- No Tables
- Very Compatible
Gargoyles
Disney produced a television show in the mid 1990s called Gargoyles. It's a great show and I'm a big fan. A few years ago Disney started to release the show on DVD. The last release was of season 2, volume 1. That was two years ago. Volume 2 has not been released. Why? Poor sales. So if you should find yourself wanting to support my work, instead I ask you pick up a copy of season 2, volume 1. It's a great show and you might find yourself enjoying it.